Science & Tech

Saturn Shows Off A Massive Spinning Vortex: ‘The Rose’

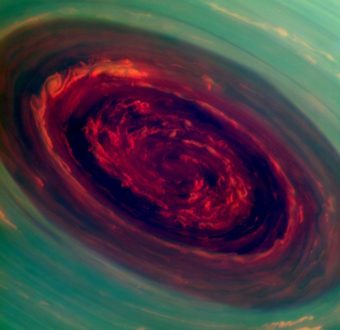
A mammoth spinning vortex is seen on Saturn, in this "false-color" photograph released by NASA Monday. The image was captured by the Cassini spacecraft. A related image, presenting what a human eye would see, is farther down this page. NASA
A mammoth spinning vortex is seen on Saturn, in this “false-color” photograph released by NASA Monday. The image was captured by the Cassini spacecraft. A related image, presenting what a human eye would see, is farther down this page. NASA

NASA is calling it “The Rose.” By any other name, it’s a mammoth storm on Saturn’s north pole. Its eye spans an estimated 1,250 miles — 20 times the size of an average hurricane’s eye on Earth. Winds in the Saturn storm’s eye wall are believed to be four times as fast.
The stunning image of the spinning vortex was given “false colors” to emphasize low clouds (in red) versus high clouds (in green). NASA estimates that the clouds at the outer edge are moving at up to 330 miles per hour.

“The hurricane swirls inside a large, mysterious, six-sided weather pattern known as the hexagon,” NASA says. The space agency’s analysts say the storm has likely been swirling in the same spot for years — because it’s on a pole, there’s nowhere for it to drift.

NASA’s Cassini spacecraft captured the image, one of the first to offer a high-resolution detailed view of Saturn’s north pole. Having passed through its equinox in 2009, the pole is now in sunlight.

Because it takes Saturn about 30 years to orbit the sun, its equinox comes “roughly every 15 Earth years,” according to NASA. The last sunlit images of Saturn’s north pole were taken back in 1981, by Voyager 2, the agency says. But its view wasn’t as good as Cassini’s.

“Such a stunning and mesmerizing view of the hurricane-like storm at the north pole is only possible because Cassini is on a sportier course, with orbits tilted to loop the spacecraft above and below Saturn’s equatorial plane,” says Cassini deputy project scientist Scott Edgington, of NASA’s Jet Propulsion Laboratory in Pasadena, Calif.

NASA says it can change Cassini’s orbit every few years — but as you might imagine, it’s not as easy as flicking a finger to tilt a hat to a jaunty angle.

“Because the spacecraft uses flybys of Saturn’s moon Titan to change the angle of its orbit,” the agency says, “the inclined trajectories require attentive oversight from navigators.”

Back in the summer of 2004, Cassini became the first spacecraft to enter Saturn’s orbit, as NPR’s Richard Harris reported. To get there, Cassini traveled 2.2 billion miles.


Read original article

Saturn Shows Off A Massive Spinning Vortex: ‘The Rose’

Virgin Galactic’s SpaceShipTwo Passes First Rocket Test

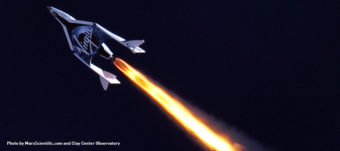
Virgin Galactic’s SpaceShipTwo — designed to carry paying passengers beyond Earth’s atmosphere — passed a key test Monday, shooting past the speed of sound under its own rocket power.
The spacecraft developed by Sir Richard Branson’s space tourism venture dropped from its mother ship over the Mojave Desert and then, for the first time, fired its engine. It hit Mach 1.2 and reached an altitude of 56,000 feet before gliding to a landing.

“The rocket motor ignition went as planned, with the expected burn duration, good engine performance and solid vehicle handling qualities throughout,” Virgin Galactic president and CEO George Whitesides said in a statement. “The successful outcome of this test marks a pivotal point for our program. We will now embark on a handful of similar powered flight tests, and then make our first test flight to space.”

You can see the test in the video above.

As Space.com writes:

“SpaceShipTwo is a suborbital vehicle, designed to carry space tourists on trips to the edge of space and back for $200,000 a ride. Though these flights wouldn’t make a full orbit of the planet, they would provide passengers with a brief experience of weightlessness and a view of Earth from the blackness of space. …

“If test flights continue to go well, SpaceShipTwo may carry passengers as soon as this year or 2014, Virgin Galactic officials have said. Already, more than 500 people have signed up for the flights, which will be run out of Spaceport America in New Mexico once testing is complete.”

Branson said in a statement that Monday’s test is “without any doubt our single most important flight test to date,” adding that it’s a “very realistic goal” for the rocket ship to make a trip into space by the end of the year.


Read original article

Virgin Galactic’s SpaceShipTwo Passes First Rocket Test

Restrictions announced for ADFG sampling program

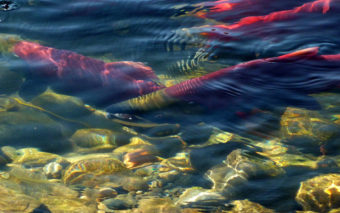
Spawning sockeye salmon
Spawning salmon

Alaska Department of Fish and Game sampling for sport-caught ling cod, rockfish, and king and coho salmon has been scheduled for various ports in Southeast Alaska.
During the designated time frames, returning anglers are prohibited from filleting, mutilating and de-heading those species. The restriction applies to fishermen docking at ports on the road system, unless the fish have been consumed or preserved on board.

The restriction is meant to maximize information obtained through the sampling program. Southeast Alaska management plans require length and sex information for lingcod, length information for rockfish, and identification of tagged king and coho salmon, all of which can be obtained only when fish are intact.

The restriction doesn’t apply to gutting and gilling fish before returning to port.

In Ketchikan, the designated time frame is April 29 through Sept. 15. In Craig and Klawock, the time frame is May 6 through Sept. 1.

Time frames for other Southeast communities are below:

Sitka: 12:01 A.M. Monday, April 29, through 11:59 P.M. Sunday, September 15, 2013.

Juneau: 12:01 A.M. Monday, April 29, through 11:59 P.M. Sunday, September 15, 2013.

Petersburg: 12:01 A.M. Monday, April 29, through 11:59 P.M. Sunday, September 1, 2013.

Wrangell: 12:01 A.M. Monday, April 29, through 11:59 P.M. Sunday, September 1, 2013.

Haines: 12:01 A.M. Monday, May 6, through 11:59 P.M. Sunday, June 23, 2013.

Skagway: 12:01 A.M. Tuesday, May 28, through 11:59 P.M. Saturday, August 31, 2013.

Gustavus: 12:01 A.M. Monday, May 6, through 11:59 P.M. Sunday, September 1, 2013.

Elfin Cove: 12:01 A.M. Monday, May 6, through 11:59 P.M. Sunday, September 1, 2013.

Yakutat: 12:01 A.M. Monday, April 29, through 11:59 P.M. Sunday, September 1, 2013.

Students at Alaska Pacific University research big fisheries questions

Photo by Annie Feidt, APRN – Anchorage

There are more questions than answers about the problems facing fisheries in Cook Inlet. And scientists working on those problems are chronically short on time and funding. But a new fisheries program at Alaska Pacific University in Anchorage has students tackling some important research questions. And it isn’t just graduate students doing the work, undergrads are getting their feet wet doing real science too.

In a cave-like basement room on the APU campus Sarah Webster is grinding dried halibut tissue. Her high tech tool for the job? A mortar and pestle:

“I’m starting to get some really nice calluses on my hand. The first couple days were really painful.”

Webster is discovering the gritty realities of graduate student lab work at APU.  She’s studying why pacific halibut are getting smaller. When she’s done grinding the tissue samples, she’ll send them off to a lab for high tech analysis that will tell her what the fish ate in the months before it died:

“Something has changed so halibut aren’t growing as quickly and because growth is related to how much nutrition and how much food you intake, it makes sense that would be what the mechanism is.”

A 15 year old halibut today is half the size it was 40 years ago. Webster’s halibut study is just one of more than a dozen fisheries research projects APU Professor Brad Harris is overseeing. He arrived at the university two years ago and has quickly turned the marine biology program into a research engine for fisheries in Alaska. It’s the only applied fisheries university program in Anchorage. Harris says it just makes sense:

“If we’re going to go out and do this work, we might as well work on something that matters and produce a product that’s useful.”

So Harris partners with federal and state biologists to find appropriate research projects. And he doesn’t leave all the fun stuff to his graduate students.

Undergraduates are helping with a Fish and Game razor clam study near Kenai. They gather halibut data in Homer in the summer. And this semester, he had them working to figure out why two scallop beds in Kamishak Bay have declined sharply in the last decade.

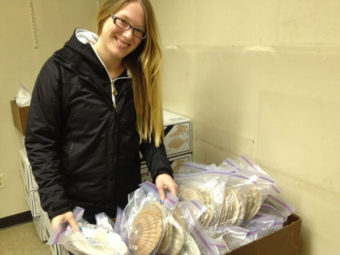
APU Junior Angela Wilkenson leads me into a storage room where 25 seafood freezer boxes are stacked, all full of scallop shells. That’s 12,000 shells the Homer Fish and Game office sent to APU for analysis.

The students are trying to determine if an invasive worm has gotten more prevalent in the scallop shells as the population has declined. They figured out a way to use a camera and computers to analyze how much of each shell was infected with the worm. It was tedious work. But Wilkenson says they got the answer.

“As the scallop population has seemed to decrease the worm prevalence has seemed to increase.”

Does that mean the worms are causing the population decline? That will take more study. But Homer based Fish and Game biologist Ken Goldman says the data is fantastic. The Department doesn’t have enough biologists to tackle all the research projects that would help them do a better job managing the fisheries.

“I’m just a geeky scientist, but that’s the stuff that gets me excited. To make sure we can pursue that goal of sustainable fisheries and to foster responsible management, it takes data. Without data all opinions are equal. So data is what we need to make the right decisions as we move forward.”

And Professor Harris says coming up with that data helps his students understand what a career as a fisheries biologist is all about. They quickly figure out that it’s either not for them, or it is. And if it is- Harris’ teaching philosophy gives them full rein to start digging in deep:

“As soon as undergrad students understand what they really want to do, their courses have a new context. They see that this is something they need to get somewhere, versus an impediment they have to get over to get a degree. Getting the degree ceases to be the goal. Being a proficient scientist that can really contribute starts to become what they focus on. And that’s exciting to them.”

Harris says he has had no trouble attracting interesting research questions for his students to take on. He quickly found himself dealing with the opposite problem, having to say no to worthy projects. But there is always next year, with a whole new group of students ready to learn.

1960s Satellite Images Add To Evidence Of Shrinking Sea Ice

An artist's rendering of the Nimbus 1. NASA
An artist’s rendering of the Nimbus 1. NASA

Scientists have digitized and analyzed imagery taken by one of the first U.S. weather satellites to create a montage showing the extent of polar sea ice in 1964 so they can compare it to more recent satellite photos.

The images from low Earth orbit beamed down by the Nimbus I satellite in 1964 reveal that Antarctic ice in September of that year was “substantially higher” than estimates for the period 1979-2000, according to the analysis published in the journal The Cryosphere.

“Ships would go down in the 1960s and, of course, they would only see small parts of the Antarctic, but anecdotally it seems like there was more ice back then, and this research appears to confirm that,” the lead author, W.N. Meier of the National Snow and Ice Center at the University of Colorado, Boulder, was quoted by the BBC as saying.

“We’ve seen since 1979 some small increasing trends in the Antarctic with a lot of variation from year to year. So the question is: Have we been seeing a real shift or something more cyclical? … [This] gives us some indication that what we are seeing now may actually be within the bounds of natural variability,” Meier said.

But Meier and fellow scientists D. Gallaher and G.G. Campbell, also of the NSIDC at the University of Colorado, Boulder, said measuring Arctic sea ice proved more difficult. There was less data available and it was more difficult to analyze. So, they combined the Nimbus images with other sources that were available for the Arctic region from the same time period and concluded “that [the] September extent in the Arctic may have been generally stable through the 1960s and early 1970s, though more years of data are needed to confirm this.”

The Nimbus program of weather satellites began with the launch of Nimbus I in August 1964 and finished with the October 1978 launch of Nimbus VII. While the satellites became progressively more sophisticated, Nimbus I was only able to send black and white video, which was then recorded on 35mm film.

“The [film] canisters were kind of forgotten, almost lost in time, until about four years ago when they were found and it was realized they might contain some useful, interesting data,” Meier told the BBC.

“We then got some funding to digitize the data and analyze it. I was skeptical at first; the quality of the data is nothing like what we can get now,” he said. “But it turned out to be really good, especially in the Antarctic, where it was surprisingly easy to determine the ice edge. Don’t get me wrong, it was certainly a challenge.”


Read original article

1960s Satellite Images Add To Evidence Of Shrinking Sea Ice

Stunning Video: 3 Years Of The Sun In 3 Minutes


We all deserve a break from the past week’s news. This NASA video could be just the right thing.

According to the space agency, NASA’s Solar Dynamics Observatory (SDO) “captures a shot of the sun every 12 seconds in 10 different wavelengths.” The video features images from the past three years, “at a pace of two images per day.”

NASA adds:

“There are several noteworthy events that appear briefly in this video. They include the two partial eclipses of the sun by the moon, two roll maneuvers [by the observatory, as it changes position], the largest flare of this solar cycle, comet Lovejoy, and the transit of Venus. The specific time for each event is listed below, but a sharp-eyed observer may see some while the video is playing.

— “00:30;24 Partial eclipse by the moon

— “00:31;16 Roll maneuver

— “01:11;02 August 9, 2011 X6.9 Flare, currently the largest of this solar cycle

— “01:28;07 Comet Lovejoy, December 15, 2011

— “01:42;29 Roll Maneuver

— “01:51;07 Transit of Venus, June 5, 2012

— “02:28;13 Partial eclipse by the moon”

New York’s Daily News calls the video “mesmerizing.” The Washington Post‘s Capital Weather Gang says it’s “dazzling.” Gizmodo goes with “gorgeous.”

This is a composite of 25 separate images spanning the period from April 16, 2012, to April 15, 2013. In a video, NASA has also collected three years' worth of such images and set them in a new video.
This is a composite of 25 separate images spanning the period from April 16, 2012, to April 15, 2013. In a video, NASA has also collected three years’ worth of such images and set them in a new video.

(H/T to Huff Post Science.)


Read original article

Stunning Video: 3 Years Of The Sun In 3 Minutes

Site notifications
Update notification options
Subscribe to notifications