
In the next 50 years, there’s a 9 percent chance of an Aleutian Islands earthquake so strong it could send a devastating tsunami to Hawaii.
Oceans
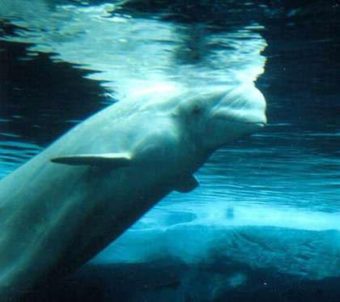
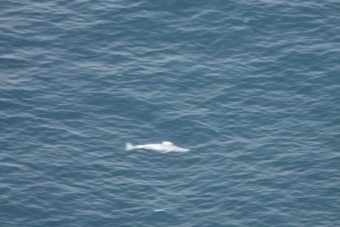
Observation group launches info hub on Cook Inlet beluga whales
The Cook Inlet Beluga Ecosystem Portal is a one-stop shop for beluga data that its creators hope will help scientists and the public make more informed decisions in the future.
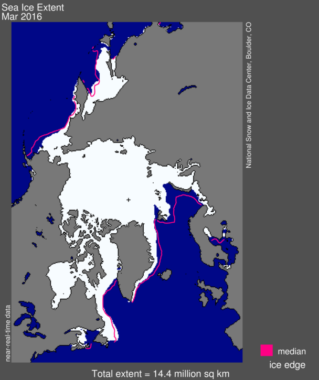
Satellite used to record sea ice data malfunctions
Scientists are scrambling to calibrate a month of missing data.
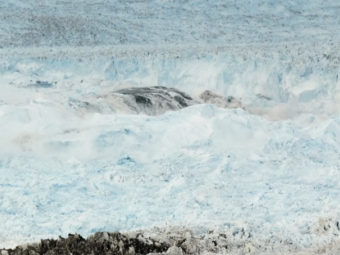
A Hunk Of Planet Dissolves Before Our Eyes
It’s been there for thousands, maybe tens of thousands of years — a huge, solid, endless mass of white ice. Then, all of sudden (“It’s starting, Adam,” says an onlooker) there’s a crack, then another, and whoosh, an immense field vanishes — splits, splits again, and right before your eyes (you’ve got to see this) sinks into the sea. This is how ice leaves our planet.
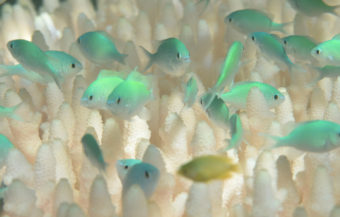
New Photos Show The Rapid Pace Of Great Barrier Reef Bleaching
Over six months, healthy coral is bleached and then covered with algae. Scientists say bleaching has hit 93 percent of the Great Barrier Reef in Australia’s “biggest ever environmental disaster.”
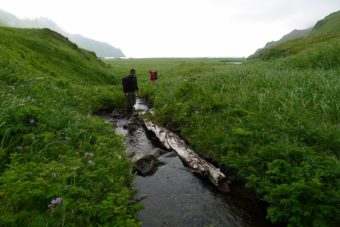
Two marine mammal specialists conduct Kodiak’s first whale survey of 2016
A mass die-off of at least 40 whales last summer caused the National Oceanic and Atmospheric Administration to declare an “unusual mortality event.” Many of those whales were spotted on or around the Kodiak Archipelago.