Climate Change

2023 was a tragic and bizarre year of wildfires. Will it mark a turning point?

Two women embrace and cry as they look out over Lahaina, in Maui, Hawaii, which was severely damaged by a wildfire in August. (Claire Harbage/NPR)

Come August, it’s usually the massive wildfires in California and the West that are dominating the headlines. But not this year. The remnants of Hurricane Hilary were dumping record rain on the mostly arid region and instead it was the tropics that were on fire.

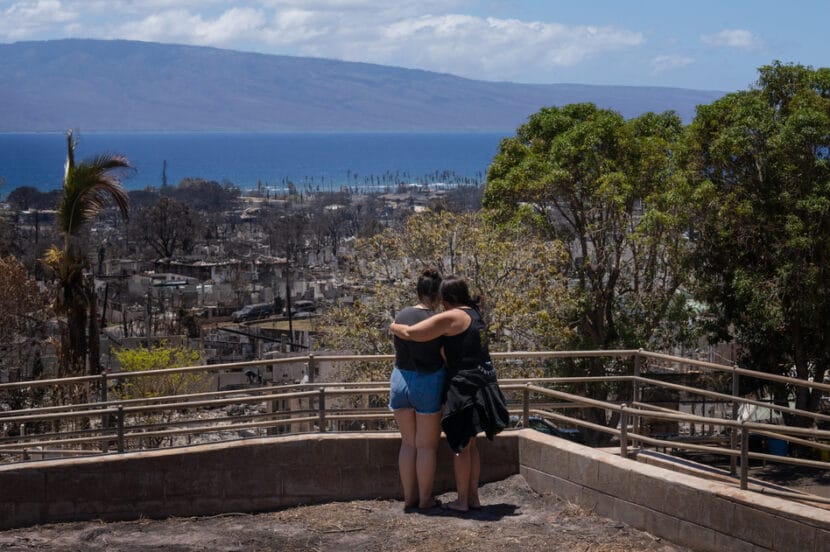
In Hawaii on Aug. 8, gale force winds from a different hurricane — Dora — collided with extremely dry terrain on the western coast of Maui. Toppled power lines helped ignite what would become the deadliest wildfire in modern U.S. history, killing 100 people and destroying most of the historic tourist town of Lahaina.

Some had no other means of escape but to jump into the ocean.

In the aftermath of the fires, a seaside resort just north of Lahaina was transformed into an emergency assistance center and shelter. A shaken David Ormsbee said he was grateful to make it out alive along with his girlfriend and cat.

“The smoke just kept getting blacker,” he said. “It started getting hotter and hotter and we just got the hell out.”

The fire destroyed his apartment and the business where he worked. The couple felt fortunate to have a car on loan from his sister.

“It’s just the matter of the waiting game, you know, what do you do next? I’m working one day at a time,” Ormsbee said.

A waiting game that could take months if not years to return to some sense of normalcy, if recent climate-driven wildfire disasters are any indication.

In terms of land burned, 2023 was a relatively quiet fire year

Tragic, unthinkable and even bizarre may be words that best sum up 2023 when it comes to wildfires. There were the deadly blazes in the tropics, but also near the Canadian arctic, causing thick, toxic smoke to blow down the US eastern seaboard for weeks. Meanwhile, the western U.S. seemed to enjoy a relative reprieve. Nationwide, about 2.6 million acres burned, compared to 7.5 million last year and more than ten million in 2020.

On Maui, it’s widely believed it could take a decade or longer to fully recover. Reconstruction is still a long ways out as crews are still clearing debris. There was also already a severe housing and labor shortage before the fires.

People put up a fence around the homes burned by the wildfire in Lahaina on Aug. 22. (Claire Harbage/NPR)

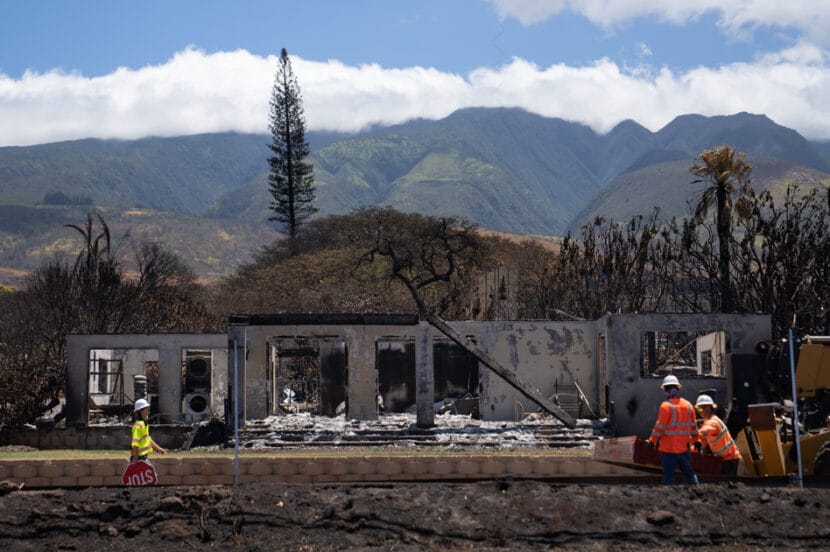
“When we think about recovery in basic terms, we’re often thinking, well, how long does it take to rebuild a house, maybe a couple years if there’s a backlog in contractors,” says Catrin Edgeley, professor of forestry at Northern Arizona University. “But a rebuilt house does not mean that you’re recovered.”

Even rebuilding a home in two years after a wildfire is considered fast. Edgeley researched survivors of the Marshall Fire that ignited in the winter near Boulder, Colorado two years ago. She found that many fire victims can be retraumatized during the recovery because they have to prove and rehash the crisis again to their insurance companies and FEMA. It can slow everything down further.

“And that can take a significant toll if you think about the stress that can create, the re-living of that experience over and over,” Edgeley says.

2023 also marked a milestone for Paradise, California

Many survivors of wildfires today are quickly encountering a sobering reality: Even if they have insurance, it’s usually not enough to cover the costs of rebuilding, particularly in this era of high inflation.

In some parts of the West, particularly California, fire survivors are also struggling to even get insurance for homes they plan to rebuild.

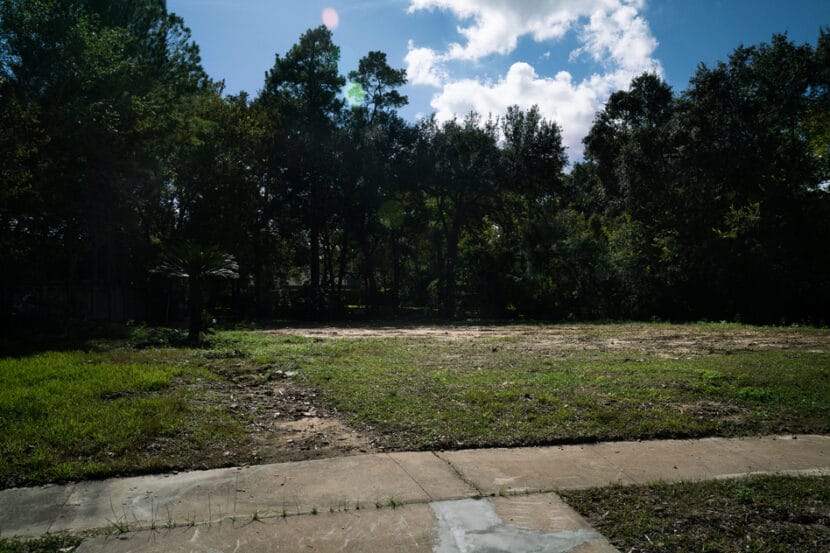
In a forest just outside Paradise, California, Bernadette Grant and Richard Fox have only recently come up with a long term plan to rebuild on property she owns that the family used to use as a camping area.

“As you can see we’re slowly but surely clearing out the space,” Grant says.

Grant, who grew up in Paradise, lost her home in the 2018 Camp Fire, as did her mother who is in her 80s and recently moved back into a newly built home on her property in town.

Bernadette Grant and Richard Fox stand in front of solar panels on property where they plan to build a home near Paradise, Calif. (Kirk Siegler/NPR)

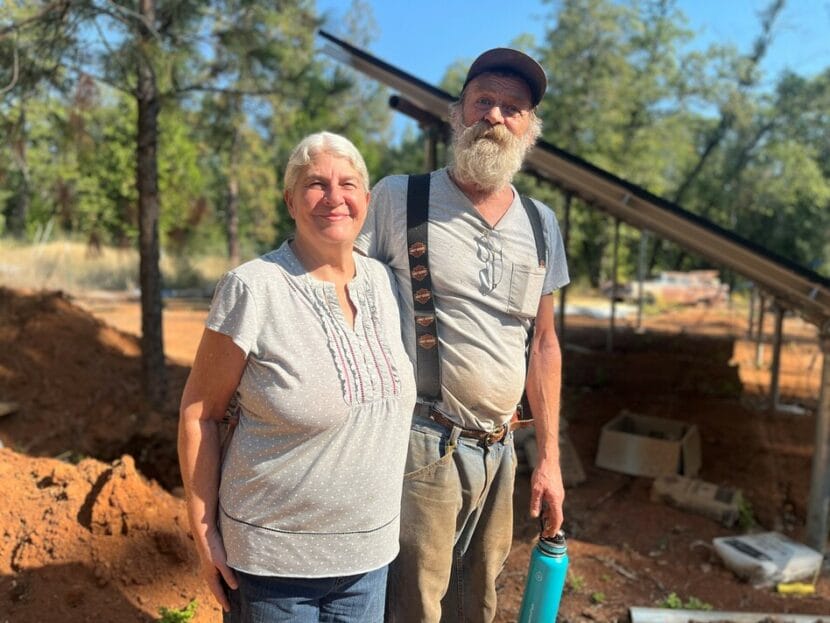
During a break from thinning trees on the property, her partner Richard Fox says they’re not even sure if the property can be insured. He points to a cluster of trees 100 yards or so to his left which he says would catch fire almost immediately with lightning or some other ignition.

“We’re not even close yet to that stage of bringing someone in and trying to get insurance on it,” Fox says.

Before Lahaina, the Camp Fire had been the deadliest wildfire in the U.S. in a century – it claimed 85 lives. For survivors like Fox and Grant, the crisis in Maui stirred up bad memories. It’s still fresh they say, as they continue work cutting trees that they’ll use for lumber to build a modest cabin. Right now, they’re living in an RV on the property.

“In the meantime we just keep clearing the property,” Grant says as Fox chimes in: “Trying to make it safe, that’s all we can do.”

This Fall, Paradise leaders and other Camp Fire survivors have been meeting with their counterparts in Lahaina, guiding them on how to recover from the unthinkable.

This year marked some positive milestones for Paradise, however, where state of the art power lines were buried underground, the downtown was refurbished with sidewalks and new bike paths that also serve as egress escape routes.

“There’s a tremendous amount of optimism and sense of community,” says Mitchell Snyder, a disaster recovery expert at the University of California-Davis. “They’re rebuilding something and they know that they’re an underdog in all this and they’re excited about that.”

A vacant lot in Paradise, California where a home stood before the 2018 Camp Fire. (Kirk Siegler/NPR)

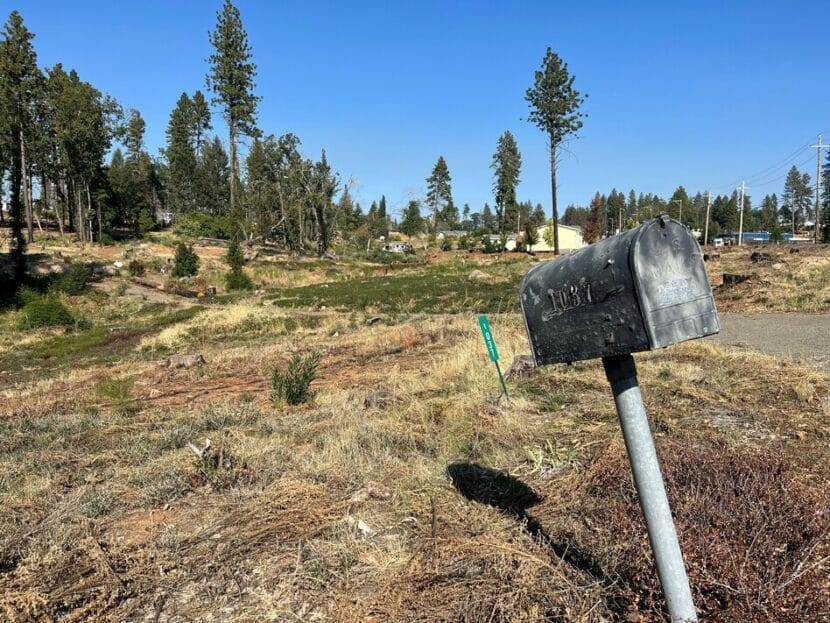
Today, about a third of Paradise has been rebuilt. Snyder says that’s remarkable when you consider that almost 19,000 homes and businesses burned in and around Paradise in 2018 – including 90% of the town itself.

“In the future, as we look towards the one year anniversary of Lahaina, just remember that there are people behind the numbers that we see on the headlines,” Snyder says. “For so many people this was the worst day of their life.”

Is 2023 finally a turning point in U.S. Firefighting Policy?

One silver lining of this tragic and bizarre fire year, according to experts, is that the wildfire threat might be a lot more real to decision makers in Washington, D.C.

Toxic smoke turned the skies an apocalyptic orange up and down the east coast, obscuring the Manhattan skyline for weeks, giving a glimpse of what many summers in the West are already like. Pressure is building to prioritize prevention, instead of waiting to fight these modern megafires later.

In Hawaii, a shell-shocked Curt Hanthorn was waiting in line to get his mail at the Post Office in Lahaina a couple weeks after the fire in August. He said he was frustrated by all the finger pointing after the crisis.

“Pointing blame, it’s the electric company’s fault, it’s the county’s fault, it’s Joe Biden’s fault, it’s everybody’s fault,” Hanthorn said. “The fact of the matter is I saw it from the beginning it moved so fast…like a blow torch.”

No one is stopping fires like these, he said.

Copyright 2023 NPR. To see more, visit https://www.npr.org.

People are leaving some neighborhoods because of floods, a new study finds

An empty lot where a house once stood in Houston. The former residents moved because of flood damage. A new study suggests that people are moving away from the most flood-prone neighborhoods in cities that are otherwise growing in population. (Claire Harbage/NPR)

Hundreds of thousands of neighborhoods in the United States are seeing population decline as a result of flooding, new research suggests. Those neighborhoods are often located in areas that are growing in population overall, including parts of Florida, Texas and the region around Washington, D.C.

The results underscore how flood risk – which is growing due to climate change – is already affecting where Americans live.

“People are being more selective about where they live,” says Jeremy Porter, one of the authors of the study and a researcher at the First Street Foundation, a research and advocacy organization that publishes analyses about climate hazards including flooding. The study was published in the journal Nature Communications.

Americans are flocking to some of the most flood-prone parts of the country, including coastal areas, and low-lying cities in Florida, Texas and coastal Virginia. At the same time, heavy rain and sea level rise from climate change means floods are getting larger and more frequent.

As a result, the cost of flood damage in the U.S. has skyrocketed in recent years. The Federal Emergency Management Agency, home insurance companies and climate and housing experts all warn that huge financial losses from flood damage are not sustainable for families or the economy.

At the same time, people buying homes are increasingly aware, and wary, of flood risk. More and more states are requiring that homebuyers receive information about whether a house has flooded before, and whether it is likely to flood in the future. Some real estate listing sites include information about flood risk. And people are less likely to search for flood-prone properties when they are given information as part of the listing about whether a home flooded in the past or is likely to flood in the future, according to a study by the real estate website Redfin.

But if people are trying to avoid moving to flood zones, why are so many people ending up in the most flood-prone parts of the country? The authors of the new study offer some new insight.

They looked at the number of people living in each of the more than 11 million census blocks in the contiguous U.S., and analyzed how that number changed in places with high exposure to floods versus lower exposure to floods. They found that about 7% of census blocks – which are roughly the size of a city block – are experiencing population decline due to flood exposure.

They estimate that those neighborhoods saw a net loss of about 9 million residents between 2000 and 2020. And they found that many of those neighborhoods are located in places that are growing overall, such as South Florida and Southeast Texas.

The results suggest that the influx of new residents into flood-prone cities such as Miami and San Antonio may obscure the millions of people who are moving more locally to get away from the lowest-lying neighborhoods in those cities.

Moves to the Sun Belt “are a macro migration trend,” explains Porter. “But they’re dwarfed by the amount of people that move within their same city. Keep the same job, keep the same friends, stay close to family.”

Previous research has found that most people stay local when they move to a new home, including in situations where a flood disaster forced them to relocate. That means decisions about where to live and how to stay out of harm’s way often come down to block-by-block or even house-by-house comparisons.

And, while flood risk appears to play a role in where people choose to live, social factors including race and class are also hugely important, says Kevin Loughran, a sociologist at Temple University who studies relocation from flood zones.

“Flood risk, or environmental risk in general, is not the only criteria they’re using to make these decisions,” says Loughran.

The new study offers a new level of national insight into how flood risk might be affecting local trends in population, he says. But the details are still fuzzy, and further research is underway by social scientists and others to study exactly how people who live in areas threatened by climate hazards decide whether, and where, to move.

Copyright 2023 NPR. To see more, visit https://www.npr.org.

‘We’re always going to be surprised’: Wrangell’s tragedy highlights Alaska’s lack of landslide monitoring

A view from the the Wrangell slide, down to Zimovia Highway. (Photo courtesy of Alaska Department of Transportation)

The Wrangell landslide happened in an instant. 

Somewhere high on a hillside above Zimovia Highway, the slope started moving. In a matter of seconds, a river of mud fanned out and ran for nearly 4,000 feet, crossing the beach and spilling into the water. On its way, it tore up more than 37 acres of land.

People living there had little warning — just the sound of the slide. It buried two houses, leaving five people dead and one still missing.

According to state geologist Barrett Salisbury with the Alaska Department of Natural Resources, it’s extremely challenging to give warning for disasters like this.  

“We’re always going to be surprised by a landslide event,” said Salisbury. “We could give you an estimate of where we think the hotspots for future activity could be  — would be — but there’s no guarantee.”

The only guarantee, Salisbury said, is that those hotspots exist all across Southeast Alaska, where many communities have homes nestled on steep mountain slopes. And human-caused climate change could help to trigger even more landslides across the region. 

Landslides are incredibly complex. Each one is shaped by the unique geology, hydrology and vegetation on a given slope. That’s the biggest reason why they’re so hard to predict. 

But scientists like Gabriel Wolken of the Alaska Division of Geological and Geophysical Surveys say that Southeast mostly lacks the kinds of monitoring that could make people safer. 

“We have, you know, this broad understanding of the different ingredients that come into play to aid the development of a landslide,” said Wolken, who manages the state’s climate and cryosphere hazards program. “But we still lack the data.”

The debris that once covered Zimovia has been cleaned up, but the scar of the slide remains (City and Borough of Wrangell)

How debris flows start

Salisbury was one of a team of geologists who worked to gather data about the Nov. 20 slide in the days after it happened. There are still a lot of unknowns. 

“We don’t know where it started. We don’t know why it started exactly,” Salisbury said. “But we do know the moisture had to be there.”

Heavy rain almost always characterizes the “when” of Southeast landslides. Like the Wrangell slide, deadly slides in Sitka in 2015 and in Haines in 2020 happened during strong rainstorms. 

On steep slopes, the earth is constantly resisting the force of gravity, thanks to the friction between grains of soil. But grains of soil are lumpy or jagged, and they don’t fit together perfectly. 

“Doesn’t matter how tightly you pack them,” Salisbury said. “Those little grains only are in contact on small portions of their total surface area.”

So there’s always space between them. In the 24 hours before the Wrangell landslide, a strong storm dumped three inches of rain. All that water seeped into those spaces between the grains, building pressure in the pores of the soil. 

Then, right before the slide, the rain intensified. In six hours, that burst dropped more than an inch of rain. The water kept pushing as the pores filled up completely.

“Eventually, the soil particles will be pushed away from one another,” Salisbury said. 

When that happens, solid earth becomes a slurry of mud and water, and it’s primed for a type of landslide called a debris flow. 

Different things can cause the earth to give way. An earthquake could shake it loose, or it could fall away from a crack caused by the slope’s topography. Or a falling tree could destabilize the soil as it pulls up its roots. In Wrangell, where wind gusts of at least 60 mph battered the trees during the storm, that’s one possibility. 

Geologists do know that the debris flow in Wrangell began on a narrow course, just 95 feet wide. As it picked up speed, the slide fanned out to more than 700 feet at its widest, and the sodden soil got even heavier, gaining even more momentum as it picked up debris in its path. 

“Trees, shrubs, homes, cars — anything in the way becomes a part of this debris flow,” said Salisbury.

All that material propelled the slide across Zimovia Highway, where it pooled on the pavement in an enormous pile that took days to clear. 

“It is like soup,” Salisbury said. “The big front end loader was trying to stack it higher, and they’d plop it down and it’d go right back where it was.”

A search and rescue volunteer uses a probe in the mucky remnants of the slide (Photo courtesy of City and Borough of Wrangell)

Not enough weather stations

Soils in Southeast Alaska can take on a lot of water — they’ve evolved that way by enduring thousands of years of heavy rain. And the amount of rain that came down on Wrangell before the slide was not necessarily unusual. 

But it’s incredibly difficult to pinpoint an exact threshold for where there’s enough rain to trigger a landslide — and Southeast’s lack of weather data makes it impossible. For most communities, the most complete and official weather data is collected at airports, on flat ground, close to sea level. 

“We don’t have extensive [weather] stations around the Southeast,” Salisbury said. “Especially not on a small island like Wrangell, where there are lots of homes across many different types of terrain.”

The topography of Southeast Alaska creates microclimates, where weather behaves very differently across small distances. A microclimate at mile 11.2 of Zimovia Highway may explain, in part, the cause of the slide.

“It could have been a cloud literally was denser 10 miles away from town, and it rained more,” Salisbury said. “Or because of the shape of the mountains and the channels, the high winds were focused to trigger that landslide. But we don’t know.”

There are no weather records to show what happened on that ridge, but the state Department of Transportation did set up a rain gauge at the slide zone during the search. One night, that gauge measured twice as much rain as the one at the airport.  

A aerial shot shows the main slide path flanked by at least one smaller slide, which stopped just short of houses (Photo courtesy of City and Borough of Wrangell)

The “where” of landslides

Determining the “where” of a landslide can be even harder. But according to Wolken, history can be a good rule of thumb. 

“There is this repetition on the landscape,” Wolken said. “Where one landslide has occurred in the past, there is then the possibility that future landslides tend to occur in the same places.”

Residents across Wrangell Island can recall stories of smaller slides that happened in their own backyards, or their neighbors’ backyards, leaving behind piles of dirt or jumbles of boulders. More overgrown slide scars can be seen from planes or boats, including one big scar that Salisbury’s team spotted to the south of the recent slide. That old slide stopped short of houses.

Salisbury said it’s hard to pinpoint why the hill above mile 11.2 gave way. Along the ridge on either side, the slope is similar in its geology, topography and plant cover. But the Nov. 20 slide might have created new weaknesses in the hillside.

As the slide came down, it slammed into a series of bedrock ridges, including the bench of an old logging road. Those collisions caused tendrils of the liquified earth to split off on either side of the main slide — two to the north and one to the south. 

And some of those smaller slides tapped into stream beds, which funneled them even further down the hillside, where they too stopped short of houses. Now those paths are prone to slide again. 

The Alaska Department of Transportation worked to clear the slope. With two new weather stations, they’ll continue to monitor the slope stability and the safety of the road (Photo courtesy of Alaska Department of Transportation)

Studying slides in a changing climate

Despite knowing the ingredients of a landslide, Wolken said predicting them with any precision is far off for Southeast Alaska. 

“Warning systems can be developed in places where instrumentation and data are available in really high concentrations,” Wolken said. “But in Alaska, that’s a really challenging thing to achieve.”

Developing more complete inventories and maps of past slides can help. In Wrangell, the Department of Natural Resources did two aerial surveys — one this summer, before the slide, and another in late November, after the slide. 

Those datasets will be used to build models of the slopes across Wrangell, which will help reveal channelized areas, extremely steep slopes, or newly unstable slopes that may have been loosened by the same Nov. 20 storm. 

And at a state level, the department’s landslides hazard program is working with the U.S. Geologic Survey to compile a statewide landslide database, which will include as many historic slides as possible.

In the near term, the Alaska Department of Transportation will be installing two new weather stations at the site of the slide — one at the bottom of the slope and another on the ridge. Those will collect data about soil moisture, temperature, wind and rainfall at the slide area. 

A view up of the slope from somewhere atop the debris pile (City and Borough of Wrangell)

Wolken said that data is especially important as climate change, caused by the burning of fossil fuels, intensifies the risk of slides. 

“We’re in a changing environment right now, with changing climate conditions including increases in heavy rain, snowfall and rapid temperature changes,” Wolken said. 

Efforts to develop tools that can help people prepare for climate change in a slide-prone Southeast are just getting underway. After a 2015 slide killed three, people in Sitka were scared of the steep slopes all around them. 

Researchers at the Sitka Sound Science Center, with collaborators at other scientific agencies, developed a simple, risk-based warning system in an attempt to give the community some peace of mind. It took four years to install more climate stations and develop a model for forecasting landslide conditions — a much more attainable goal than predicting landslides. Many Southeast communities, including Wrangell, may look to that system as a model.

“And when it comes to predicting a landslide, it’s always going to be really very challenging, and especially with absolute certainty,” Wolken said. “But if we have data, we at least have a way to assess and monitor.”

‘The time for action is now’: NOAA’s Arctic Report Card paints a dire picture of climate change

Guy Omnik observing the sea ice near Point Hope, Alaska, in January 2020 as part of the Alaska Arctic Observatory and Knowledge Hub. (Photo by Caroline Nashookpuk)

The Arctic experienced its warmest summer on record this year due to human-caused climate change, according to the National Oceanic and Atmospheric Administration’s latest Arctic Report Card.

“Its message is more urgent than ever,” said Rick Spinrad, NOAA administrator. “The time for action is now.”

The 18th annual Arctic Report Card detailed dramatic shifts in Arctic lands, weather and climate as a result of warming. Arctic sea ice extent was the sixth lowest on record. Nearly a million acres of undersea permafrost is at risk of thawing and releasing more greenhouse gasses and heavy precipitation broke records across the Arctic, contributing to natural disasters.

“Climate change is not something that’s coming down the pipe somewhere in the future. It is happening now,” said Daniel Schindler, an ecologist at the University of Washington. “Whether you’re talking about fish, or people or birds, there are real impacts that we need to deal with right now.”

The administration and its partners held a press conference on the new report at the annual American Geophysical Union meeting in San Francisco on Tuesday.

This year’s report centered Indigenous perspectives, including contributions by a network of coastal Alaska observers from Kotzebue to Kaktovik. The observers reported sea ice loss, warmer oceans and increasingly intense storms that contribute to flooding and erosion.

“These environmental changes have real impacts on community infrastructure, traditional activities and access and availability of subsistence resources,” said Roberta Glenn-Borade, who helps coordinate the network, known as the Alaska Arctic Observatory and Knowledge Hub.

Glenn-Borade, from Utqiagvik, said despite the challenges, she sees resilience in her region.

“There’s strength in being proud that we have survived as a people to make it this far, to be able to continually thrive in our region, living off the land and sea. And we don’t plan on stopping soon,” she said.

The annual report card examines physical and biological changes in the Arctic. Scientists from around the circumpolar north described a warmer, wetter, less frozen Arctic that is more prone to extreme climate events like this summer’s wildfires in Canada and flooding in Juneau.

A section on Alaska salmon also illustrated how climate change is impacting species differently. Western Alaska chum and chinook salmon have been on a long decline, dropping to record low returns, likely a result of warming oceans and rivers. Meanwhile, sockeye salmon have reached record highs in recent years.

“These numbers were neither predictable, nor would they have been believable a decade ago,” said Schindler, the ecologist.

Schindler said sockeye’s success could actually be caused by warming waters, which are helping to grow the populations of plankton that sockeye eat.

Researchers say tracking these changes in the Arctic is important because they serve as an early indicator of how climate change will affect the rest of the planet as it warms.

Warming seas helped cause Alaska’s snow crab crash, scientists say

Three men emptying a crab pot on a fishing boat
Crew from the Silver Spray empty snow crab pots while fishing in the Bering Sea. (Courtesy of Bill Prout)

When scientists estimated that more than 10 billion snow crab had disappeared from the Eastern Bering Sea between 2018 and 2021, industry stakeholders and fisheries scientists had several ideas about where they’d gone.

Some thought bycatch, disease, cannibalism, or crab fishing, while others believed it could be predation from other sea animals like Pacific cod.

But now, scientists say they’ve distinguished the most likely cause for the disappearance. The culprit is a marine heatwave between 2018 and 2019, according to a new study authored by a group of scientists with the National Oceanic and Atmospheric Administration.

Mike Litzow is a co-author of the study and the director for NOAA’s Kodiak lab. He said starvation mediated by increased temperatures caused the collapse.

“Really the crab were not able to get the food they needed,” Litzow said. “They were just outstripping the resources that were available to them.” 

According to Litzow and his fellow researchers, the crab faced a number of compounding factors: First, higher temperatures meant increased metabolism so they needed more food; on top of that, there was less space for the crab to forage that food; and finally, the crab were just smaller than usual.

Researchers took data from the many possible hypotheses for the disappearance and they examined it alongside the data they have on the collapse. They examined possible mortality from a range of sources, including directed fishing from the snow crab industry as well as bitter crab syndrome — a fatal disease among crustaceans caused by parasites — and trawl bycatch.

The take-home message is really that none of those other proposed mechanisms explains the collapse with the data we have,” Litzow said.

He said it’s tough to know what the collapse from increased ocean temperatures could mean for other species, but it’s safe to say we’ll probably see more marine heatwaves like this, and they’re likely to be bigger and more frequent, as the world continues warming.

As we’re seeing these big surprising collapses, there is a general awareness that we have to build: we’re going to see more of those,” he said. “We need systems that can be resilient to those really outsized, surprising events.”

More carbon dioxide in the atmosphere means warmer temperatures, Litzow said, which is bad news for the cold-loving snow crab. And more greenhouse gasses also mean more acidic oceans, which can also be dangerous for some crab.

Carbon dioxide that we release through fossil fuels is also taken up by the oceans and has the effect of reducing the pH of the ocean — it makes it more acidic,” Litzow explained. “Because crab use calcium carbonate in their exoskeleton, they’re vulnerable to that acidification because calcium carbonate dissolves more and more easily as pH goes down.”

The good news — at least for snow crab — is they’re not as sensitive to ocean acidification as other species.

“In our lab in Kodiak, we’ve run a bunch of different studies over the years looking at different crab species in different ages — life history stages — in terms of how vulnerable they are to acidification,” he said. “And the good news is it looks like snow crab are one of the more resilient species — like we don’t see a strong effect for snow crab the way we do for red king crab or the way we do for Tanner crab.”

Alaska’s snow crab fishery has been closed since 2022, when regulators declared the population overfished.

The snow crab crash in combination with a two-year closure of Bristol Bay red king crab was a devastating blow to Alaska’s lucrative crab fishery, and it left some harvesters and coastal communities, such as St. Paul Island, looking for other sources of income.

Late last year, the Secretary of Commerce announced a disaster declaration for both fisheries to assist communities affected by the closures. That funding has historically taken years to reach fishermen and communities. Some Bering Sea harvesters are still waiting on disaster relief from 2019 requests.

While the bigger picture is still pretty grim — crab have been declining in Alaska since about the early 80s — Litzow said there’s still lots of cold water in Alaska’s seas and with it, hope for the spindly crustaceans.

“Snow crab have bounced all over the place,” he said. “Historically, there have been ups and downs — there have been previous overfished declarations. And we’re certainly hopeful as we see small crab showing up in the survey in 2022 and 2023.”

But, Litzow said, the rebound could take some time.

“If conditions stay reasonable for the next, say, four years, we should expect this crab to grow up to the size where they can start to support the fishery,” he said.

The snow crab crash really blindsided Alaska’s industry, and more similar surprises are likely on their way, according to Litzow. He said the more dependent a community or fishermen are on a single fishery, the more vulnerable they will be.

While diversification may be one of the most productive solutions to these kinds of startling crashes, Litzow said it’s also likely one of the most challenging.

“We have this management system where everyone has access — it’s allocated in a certain way, or everyone has gear, vessels that’s really specialized for just this particular kind of fishery,” he said. “And then when those surprises and those disruptions come along, it’s hard in practice for people to have a backup.”

Like other research, Litzow said this study isn’t the final answer, but he said it is an important step.

“It really does a great job of framing out our expectations,” he said. “We should not expect that the crab were just gone somewhere else, down on the Slope, or up in Russia, or anything like that. I think this study really makes it clear that they died, and gives us our best explanation for why that happened.”

‘It feels like I’m not crazy.’ Gardeners aren’t surprised as USDA updates key map

The U.S. Department of Agriculture has updated a map that helps gardeners to figure out which plants are most likely to survive the coldest winter temperatures in their location. About half of the country has shifted into a new half zone. (Robyn Beck/AFP via Getty Images)

A newly updated government map has many of the nation’s gardeners rushing online, Googling what new plants they can grow in their mostly warming regions.

It’s called the U.S. Department of Agriculture’s “plant hardiness zone map,” and it’s the national standard for gardeners and growers to figure out which plants are most likely to survive the coldest winter temperatures in their location.

This week the map got its first update in more than a decade, and the outlook for many gardens looks warmer. The 2023 map is about 2.5 degrees Fahrenheit warmer than the 2012 map across the contiguous U.S., says Chris Daly, director of the PRISM Climate Group at Oregon State University that jointly developed the map with the USDA.

Daly says the new map means about half the country has shifted into a new half zone and half hasn’t. In some locations, people may find they can grow new types of flowers, fruits, vegetables and plants.

The 2012 version of the Plant Hardiness Zone Map. (U.S. Department of Agriculture)
The 2023 version of the Plant Hardiness Zone Map. (U.S. Department of Agriculture)

Many of the nation’s gardeners are not surprised by the change.

“I have been stating all year long, ‘This needs updating!’,” says Megan London, a gardening consultant in Hot Springs, Arkansas, in a video she posted on Facebook. London has been gardening for 26-years, and she’s seen her region warming.

In the new map, London’s region in central Arkansas has moved from zone 7b to zone 8a. What that means for her is that she’s now considering growing kumquats, mandarin oranges, and shampoo ginger, a tropical plant.

But London says that the excitement she and other gardeners have to grow new things is tempered by another feeling: concern about human-caused climate change.

“We’re excited, but in the back of our minds, we’re also a little wary,” London says. “In the back of our mind, we’re like, ah, that means things are warming up. So what does this mean in the long run?”

The scientific community overwhelmingly agrees that humans burning fossil fuels like oil, coal and gas is the primary driver of global warming. The summer of 2023 was the hottest meteorological summer on record for the northern hemisphere, according to the National Oceanic and Atmospheric Administration.

Daly says he is hesitant to explicitly attribute the specific changes from the 2012 map to the 2023 map to climate change because of the volatility of the key statistic they used to create this map. They were mapping “the coldest night of the year, each year, over the past 30 years”, Daly says, and it’s a highly variable figure.

In an email, a press officer for the USDA says, “Changes to plant hardiness zones are not necessarily reflective of global climate change because of the highly variable nature of the extreme minimum temperature of the year.”

But Daly says, in the big picture, climate change is playing a role in changing what grows where in the US: “Over the long run, we will expect to see a slow shifting northward of zones as climate change takes hold.”

Still, for gardeners like Rachel Patterson, in Port St. Joe, Florida, the updated USDA map showing a warming region is validating, if not comforting. “It feels like I’m not crazy,” she says.

Patterson moved to her new community two years ago to help rebuild after a hurricane. She now gardens with her three-year-old and his wheelbarrow, and has seen the impacts of climate change in her Florida gardening community.

“The sweet little grannies here are just heartbroken, they can’t grow their tomatoes,” she says, “It’s so much hotter, the tomatoes burn.”

Patterson has been helping her community adapt to the heat by planting varieties of heirloom tomatoes that are more resilient to fungi that spread more rapidly in warmer climates.

She says the updated map is a reminder of the need for climate action: “It’s just going to keep getting hotter. So the government has to make policy changes to slow climate change down.”

Copyright 2023 NPR. To see more, visit https://www.npr.org.
Site notifications
Update notification options
Subscribe to notifications