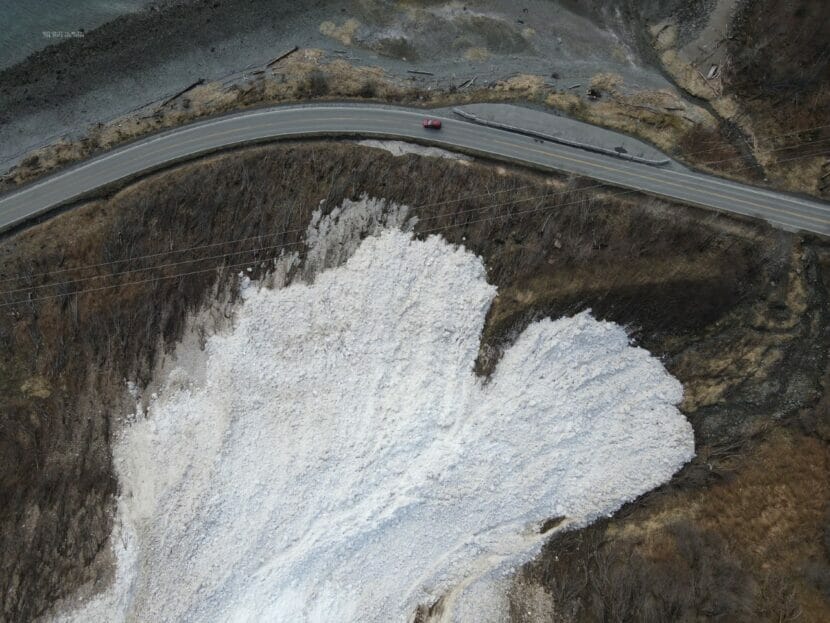
Drone imagery captures an avalanche that stopped just short of Thane Road in Juneau. (Photo Courtesy of Pat Dryer/Alaska Department of Transportation)
In the mountains above Thane Road, every snow storm, wind event or man-made explosion moves snow around. That means the snowpack — and the potential for avalanches — is constantly changing, too.
Avalanche specialist Pat Dryer with the Alaska Department of Transportation monitors those changes. But when he’s looking up the slopes from sea level, there’s a lot he can’t see.
“What other hazards are up there that aren’t visible from the ground?” Dryer said. “The ability to essentially fly to the top of the slope and figure that out would help.”
With drone technology, he can do just that. This winter, the state Department of Transportation launched a new project to use drones for faster, more precise avalanche monitoring along Thane Road.
Dryer and his team started experimenting with occasional drone missions last winter, and they do fieldwork trips often. But those methods are like snapshots. They capture a moment in time, and they examine just a fraction of the avalanche zone.
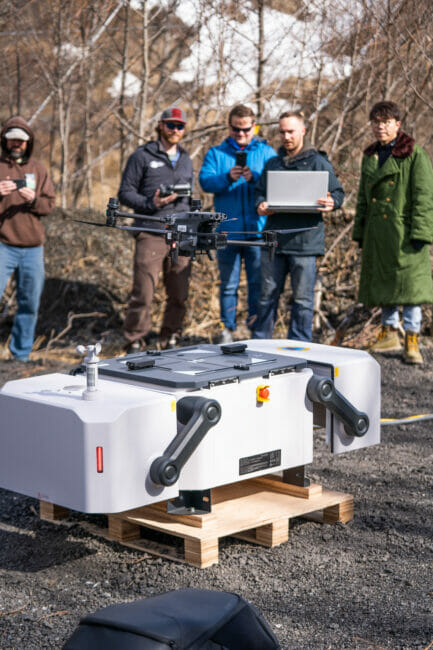
The robotic DJI drone dock houses the drone in between flight missions. It’s equipped with charging technology and data collection to upload photos to the cloud remotely. (Photo courtesy of Pat Dryer/Alaska Department of Transportation)
The new project, which is a collaboration with drone manufacturer DJI, will try to get a bigger picture with more frequent, automated drone flights.
“You can think about it kind of like a lawn mower mowing the lawn,” said Grant Hosticka, a DJI engineer who helped to launch the project. Lawnmowers cut the grass with multiple passes across the yard, patch by patch. “And drones kind of do that. But by taking photos that overlap as it goes.”
All of those photos can help avalanche specialists like Dryer map and model the snowpack using a process called photogrammetry.
“That’s taking a lot of photos and stitching them together to make a new aerial image,” Dryer said. “What we’re doing is creating a digital elevation model from the photo. In this case, it would be the total height of the snow.”
By doing this again and again over the snow season, they can understand how much snow is accumulating in avalanche start zones. That could help to estimate the size of potential avalanches, and it could inform the scheduling of the man-made avalanches that happen along Thane Road each winter.
The drone missions will be launched automatically from a new drone dock that was installed near Thane Road last month. The dock is a sleek white box — essentially a high tech parking spot for the drone — with hook-ups for charging and remote data collection between flights.
The major advantage of the dock is that it would allow drones to take off and land without a human operator on the ground. But for now, the department of transportation and the drone manufacturers are monitoring test flights closely to work out the kinks. The goal is to learn more about the drones’ battery life, data storage and resilience to Juneau’s weather.
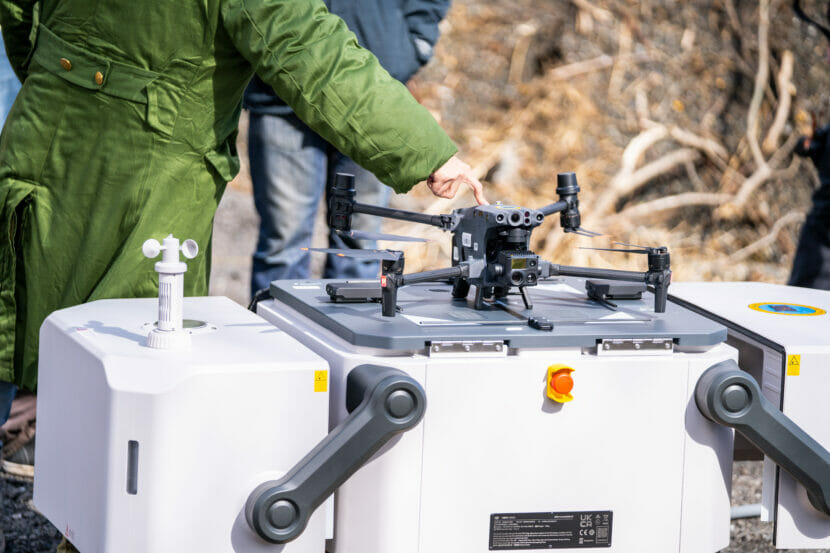
DJI team member Sunxu Xu powers on the drone on the DJI robotic dock. The dock is equipped with charging technology and data collection to upload photos to the cloud remotely. (Photo courtesy of Pat Dryer/Alaska Department of Transportation)
Only a handful of these DJI docks have been deployed in North America. Hosticka says Juneau is a great place to refine the technology.
“To be in Alaska and experience some of the tough weather, for instance,” he said. “So that the team is able to verify how it’s holding up in these conditions.”
And there are still regulatory roadblocks to overcome. The Federal Aviation Administration has not fully updated regulations for unmanned drone missions. Juneau’s avalanche specialists are working to get the permits that would allow these drone flights can be truly automatic.
Though avalanche season is wrapping up for the urban environment, Dryer said there will be plenty of time this spring to keep refining the technology.
“There’s still likely to be avalanches in the mountains for months to come,” he said. “So we’ll still use the technology and test it as best we can to learn as much as we can about it.”
By the time next year’s snow starts falling, drone missions could change the way avalanche specialists see the snowpack.
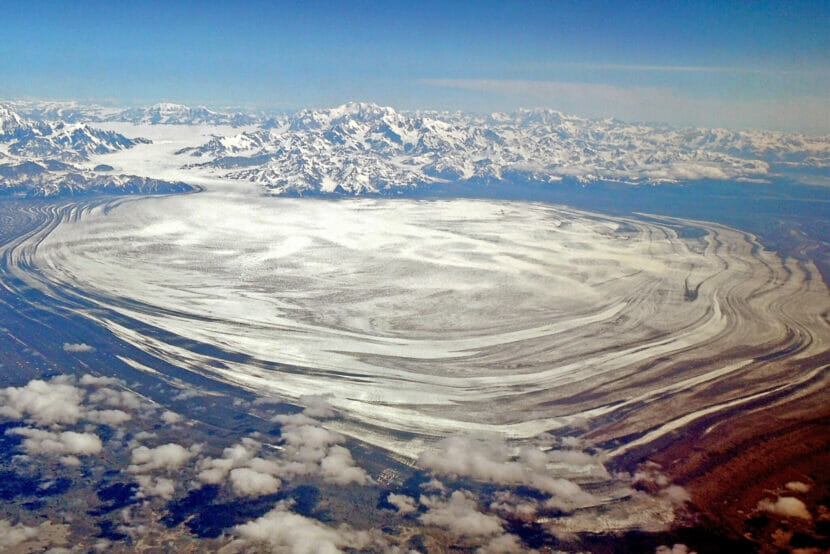
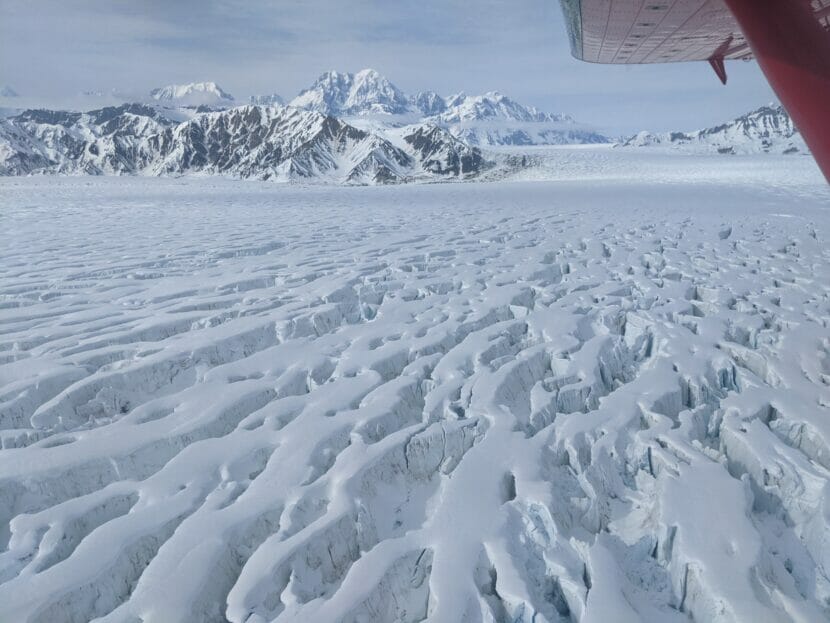
Malaspina Glacier, the world’s largest piedmont glacier, is seen on June 23, 2011. The glacier is located primarily in Wrangell-St. Elias National Park and Preserve. More precise measurements using radar have mapped out the glacier’s size and provide information about potential for contributions to global sea-level rise. (Photo provided by National Park Service)
Alaska is the home of the world’s biggest piedmont glacier — meaning it falls from a mountain into a plain. But a new study has revealed it is not quite as big as previously believed, and its low-elevation positioning makes it more highly susceptible to melting that would affect the rise in global sea levels.
The findings are in a study of Malaspina Glacier, which spills out of the St. Elias Mountains into a wide circular lobe atop a broad plain that stops short of the sea.
The study, led by University of Arizona scientists and published in the Journal of Geophysical Research, used specially designed radar devices to conduct what was, in effect, a full-body scan that penetrated down to Malaspina’s base, including into the bedrock underlying it.
It found that Malaspina’ s ice volume is about 690 cubic kilometers, about 30% smaller than prior size estimates. Two-thirds of the glacier is grounded below sea level, and those bottom portions of the glacier are undercut by several channels running as deep as 350 meters below sea level, the study found. At the same time, the land barrier that separates Malaspina from the ocean is shrinking as lagoons on it expand. Earlier research by the National Park Service, University of Arizona and UAF indicates that saltwater is already encroaching through that dwindling land barrier and that Malaspina may be transitioning into what is known as a tidewater glacier.
If Malaspina’s 590 cubic kilometers of above-sea-level ice melts, that would raise global sea levels by 1.4 millimeters, about seven times the current annual impact on sea levels by Alaska glaciers’ melt, the study found.
Exactly when and how fast Malaspina will melt out is a subject still being calculated, said the study’s lead author, Brandon Tober, a University of Arizona geophysics doctoral student. That work is being done by the same team that produced the new study, with members from UAF and the University of Montana as well as Tober and his University of Arizona colleagues. Tober said he hopes some results that forecast Malaspina’s future will be ready for release by the end of the year.
The Malaspina-scanning research was part of NASA’s Operation IceBridge, a program that ran from 2009 to 2021 and used airborne equipment to measure sea ice, glaciers and ice caps in both polar regions.
Malaspina Glacier’s crevassed surface is seen from the air in 2021. (Photo by Brandon Tober/University of Arizona)
Generally, glacier volume measurements are made through calculations from afar that factor in the physics of locations and movement over time. But those calculations are just estimates, Tober said.
“Really, the main way to figure it out is to go fly over them with radar and measure,” he said.
A challenge to radar measurements of Alaska glaciers is that in this temperate latitude, the ice is considered warm, which means it holds pools and pockets of water. That liquid water often absorbs the radio waves used by radar, interfering with any measurement attempts. To address that problem, this Malaspina project used extremely low-frequency waves that were able to penetrate those sections of liquid water, Tober said. Most of the data for the study came from flights done in 2021, completing a grid pattern over the glacier, but there is use of data collected as far back as 2013, he said.
Malaspina, located mostly in Wrangell-St. Elias National Park and Preserve, has a size and configuration that makes it a good site for such measurements, Tober said. “It’s this big lobe of ice on a broad plain,” he said. Smaller glaciers that wedged more tightly in mountainous spaces are less suitable for such radar analysis because the signals can become distorted in complex topography, he said.
Alaska holds much less than 1% of the world’s glacial ice, but Alaska glaciers are outsized contributors to global sea-level rise, which is largely the product of meltwater from land ice, including both glacier and dice sheets, and thermal expansion as the oceans get warmer and their waters take up more space.
Alaska glaciers contribute more than any other source of land ice aside from the Greenland and Antarctic ice sheets, according to various recent studies that put Alaska glaciers’ contributions at around 6% or 7%.
From 2000 to 2019, about 21% of sea-level rise is from the world’s glaciers – not counting the Greenland and Antarctic sheets — and of that, about 30% was from melt of Alaska glaciers, according to a 2021 study published in the journal Nature.
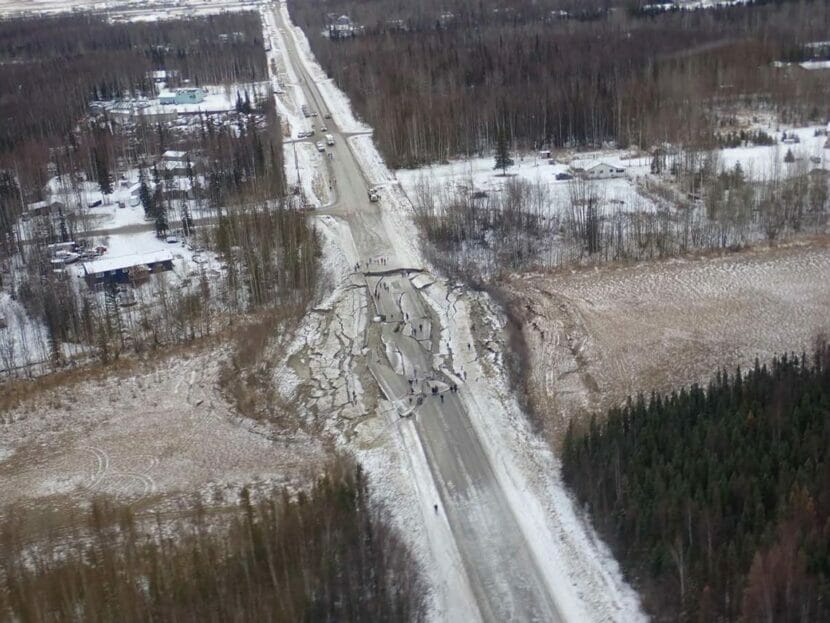
Impacts of the 2018 earthquake on Vine Road near Wasilla. Earthquakes had a quieter year in 2022. (Photo courtesy of U.S. Geological Survey)
A new report released by the Alaska Earthquake Center shows a quiet year for earthquakes in 2022. Last year alone, there were over 47,000 earthquakes in Alaska and surrounding regions. The number, while large, is actually a slight decrease in seismic activity compared to recent years, when activity has been high.
“The 2022 year was kind of a quiet year for us,” said Natalia Ruppert, a seismologist with the Alaska Earthquake Center at the University of Alaska Fairbanks’ Geophysical Institute. “But this is how the earthquake cycle works.”
She said there are years that experience higher activity, like 2018, which was notable for its large earthquake near Anchorage, and years of lower activity. But she said the past five years have seen an increased spike in recorded seismic activity.
There are two reasons for this, according to Ruppert. The first is a higher number of seismic stations in Alaska than in previous years.
During 2019 and 2020, a program funded by the National Science Foundation installed about 200 seismic monitoring sites in Alaska and Western Canada for the purpose of tracking earthquake activity. As a result, much more data is being tracked, and researchers are seeing a broader scope of seismic activity in the state. The sites were going to be removed by 2021, but the Alaska Earthquake Center was able to acquire most of these sites to continue its research.
The second reason for increased seismic activity is aftershocks. Alaska has seen a few big-ticket earthquakes in the past five years including an earthquake in 2021 that had a magnitude of 8.2.
Ruppert said that large-magnitude earthquakes generate more aftershocks, which can carry on for years after the initial earthquake.
“We always underestimate the duration of aftershock sequences. The Anchorage earthquake was projected to have aftershock sequences on the order of two and a half to three years, and now we are kind of four-plus years into the sequence,” she said.
Because of the unpredictable nature of the earthquakes — even in quiet years like last year — Ruppert still emphasized the need for the public to pay attention to earthquake activity.
“People should still be prepared because in Alaska we have very high seismicity rates, high seismic hazards, and it’s good for people just to be ready for a significant earthquake at any time,” she said.
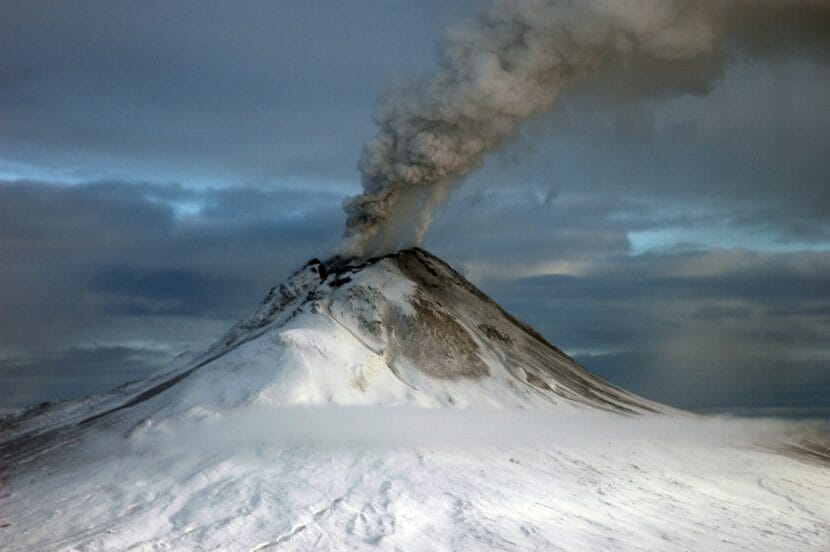
Smoke rises from Augustine volcano during its last eruption in 2006. Experts have been studying the volcano to better understand the hazards it poses to Alaskans. (Photo courtesy of U.S. Geological Survey)
Researchers are looking to the past of Alaska’s Augustine volcano to find answers about its future. An ongoing research collaboration between the Alaska Volcano Observatory and scientists at Western Washington University seeks to broaden existing knowledge about the volcano to understand the true threat that it poses to Alaskans living in the Cook Inlet region.
The research is spearheaded by Kristina Walowski, an assistant geology professor at Western Washington University. In 2020, she and her colleagues received a grant from the National Science Foundation to study Augustine, located at the southwest end of the Cook Inlet, 170 miles from Anchorage and visible from nearby Homer. They conducted much of their research last summer and are in the process of compiling it.
“Augustine is one of our highest-threat volcanoes in Alaska,” said Matt Loewen, a research geologist at the Alaska Volcano Observatory, who is also involved in the research collaboration.
The volcano is of special interest to researchers like Walowski because of its proximity to Alaska’s largest city and its history of explosions. Augustine is a unique volcano because it has erupted six times in the past 200 years, Walowski said. The most recent eruption occurred in 2006 and greatly impacted air travel in the area.
But the recent eruption is not what is most interesting to Walowski and her team. They are focused on two eruptions in particular: one 400 years ago and one about 800 years ago. Those two eruptions were more explosive than recent ones, and Walowski and her team are attempting to understand why that was the case and what that might mean for the future.
“Why has [Augustine] changed its personality? And is there a potential for it to revert back to its old ways?” Walowski said.
Her team is studying rock material from the volcano to backtrack its life to see if Augustine might have another major eruption, similar to its past big eruptions, in its future. Looking at the components of rocks is essential because scientists can get an inside view into the pressure or temperature that formed that rock, Walowski said. And in turn, that information offers up clues about how the volcano behaved in the past and how it might act in the future.
But Walowski was quick to say that she does not work in predictions. Rather, she offers a window into the past of the volcano and what might happen in the future. With this information, she said that the Alaska Volcano Observatory could be better equipped to inform people about what may happen next with Augustine. One of the biggest threats of the volcano is the tsunamis that it might create caused by a large displacement of land matter in the event of an explosion. This happened once in 1883 and could happen again, according to the U.S. Geological Survey.
“We have a mission to, you know, both understand volcanoes and provide alerts and warnings about eruptions,” he said. “Well, the academic world tends to be more about developing fundamental research, and I think this is a great case where we’re putting those together. So they’re kind of mutually beneficial.”
Walowski hopes to see the research published in the next year or so. She is excited about its potential to create a broader picture of Augustine’s threat to Alaskans, so that more people may be better prepared in the event of an emergency.
“It’s important for the public to know that there are scientists working on understanding volcanoes at many different levels and all of those little puzzle pieces can be sort of stuck together to make people and communities as safe as possible,” she said.
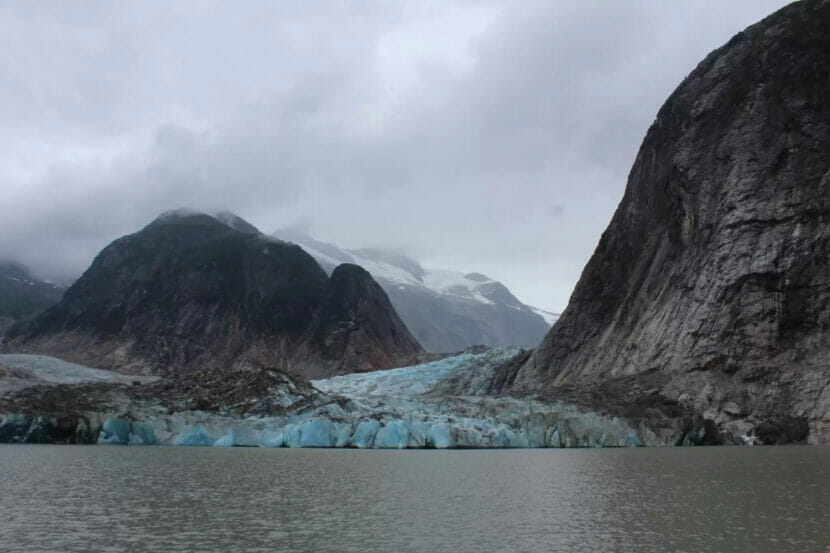
The Chief Shakes Glacier, along the Stikine River. (Sage Smiley/KSTK)
The island mountains and valleys of Alaska’s panhandle may look unchanging, but the area is moving rapidly in a geologic sense. KSTK sat down with a research geologist from the U.S. Geological Survey to talk about the deepest history of Southeast.
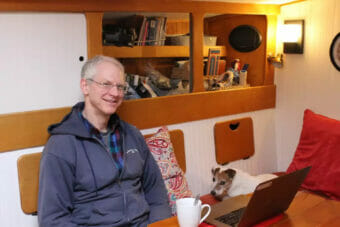
“Come on aboard,” Geologist Peter Haeussler says, responding to three sharp knocks on the deck of his 45-foot aluminum-hulled sailing boat, the Mucho Gusto. It’s home-ported in Wrangell.
His head peeks out of a cabin hatch in the center of the boat. Haeussler’s friendly dog, Happy, is part of the greeting committee, but has to be lifted down the narrow ladder to the main cabin.
Geologist Peter Haeussler and his dog, Happy. (Sage Smiley/KSTK)
Haeussler lives in Anchorage, but he has spent three decades researching the rocks of Southeast. He did his Ph.D. dissertation on a belt of rocks between Wrangell and Juneau that he “got quite interested in.”
“I think the fascinating part of geology is that you end up looking at the landscape in a world through a very different set of eyeglasses than I think a lot of other people do,” Haeussler says.
And that set of eyeglasses is what Haeussler calls “deep time” – events on a scale that dwarfs human lifetimes or even civilizations.
“I think it’s really easy for people to think about time in terms that we know and we experience,” Haeussler explains, “Which is, you know, ‘It’s spring now and you know, getting over winter, you know, it’s going to be warm in the summer.’”
Human timespans pale in comparison to geologic ones, Haeussler says. He says to really understand geology, you’ve got to think not in terms of tens or hundreds of years, but thousands to millions of years.
“So when I look at the landscape around here,” Haeussler explains, “I often think of what it was like maybe 20-25,000 years ago, when there was ice filling all of these valleys and over the tops of most of the mountains and just thinking what a different world it was at that point. Or when looking at some of the older rocks in Southeast Alaska, I mean, it seems as if most of Southeast Alaska is a piece that came from somewhere else and trying to think about the process, probably the warm tropical environments that it came from on the order of 400 million years ago. And it was out in the middle of the ocean. Pretty different”
Southeast Alaska, Haeussler says, is geologically unique. The region’s history is less as a part of a huge land mass experiencing slow continental drift, but as a smaller, more mobile chunk of crust – think of island areas like the South Pacific or around Japan.
What is now Southeast Alaska – called the Alexander terrane by geologists – probably started out near the equator. At least that’s as far back as geologists can have any idea, based on fossils here.
“Then it moved around, and then it had collisions with other little pieces and chunks, and then finally, really got crunched up against the North American margin probably in Cretaceous time,” Haeussler explains. “It would have been during the time of the big meat-eating dinosaurs or maybe a little before. And then was probably at some latitude a bit south of this, we don’t really know exactly how far and then it got sort of slivered northward along the North American margin such that it ended up getting parked here today.”
There’s another especially interesting geological history in the northernmost part of Southeast – a piece of crust born off the coast of Oregon and Washington sliced its way up the margin of Alaska and has been smashing into the Yakutat area for around 30 million years.
“That’s why there’s the big mountains: the St. Elias Mountains in the Fairweather range. And it’s even had larger-scale effects into interior Alaska,” Haeussler says. “We probably wouldn’t have Denali in the Alaska Range if it weren’t for this big piece of crust punching into the southern Alaska margin.”
It’s not the only major, earth-changing factor in the area. Offshore, there’s a fault system called the Queen Charlotte–Fairweather Fault. Haeussler says it’s similar to the better-known San Andreas Fault along the West Coast, but it’s more active.
“In some ways, the Queen Charlotte is like the San Andreas but it’s on steroids: it moves a lot faster. It’s exceedingly sharp. It’s produced more big earthquakes in a shorter period of time,” Haeussler says, “So it’s a very impressive fault system.”
The Queen Charlotte–Fairweather Fault is a strike-slip fault, where two tectonic plates are moving past each other in opposite directions. It’s moving at a whopping 5.3 centimeters per year – the length of a small lime. But compared to the San Andreas Fault, moving about two-thirds that distance each year – maybe the length of a grape – it’s quite quick. Haeussler says fast faults tend to produce more – and bigger – earthquakes.
The fault is visible north of Icy Point in Glacier Bay National Park. That’s where the fault runs on land – while the rest of it is underwater.
“If you’re on an Alaska Airlines flight from Juneau to Anchorage, and it’s a clear day, you can see that fault,” Haeussler says, “It’s this giant groove through the landscape because it’s moving.”
The glacial history of Southeast is also unique. With tons and tons of ice sitting on top of what’s now the Inside Passage, the land got forced down, while on the Outer Coast, it buckled upwards.
“Maybe it’s a little bit like, I don’t know, if you had like a fat uncle that sat next to you on the couch when you’re a kid. But the ice sheet was a little bit like the fat uncle that sort of sat down on things,” Haeussler explains, “And then if you were next to him on the couch, then you’re about to be flipped up in the air because, you know, things go up, but the other part of the wait, so then when the uncle gets up off the couch, then you go back down.”
Haeussler says now that the glaciers have retreated significantly back onto the mainland, the earth’s crust is rebounding. Sites that used to be shoreline near Wrangell are now hundreds of feet in the air, while ancient coastlines on the Outer Coast are slowly sinking.
Haeussler says he made his way to geology through rock climbing: “And then at some point, I got interested in: what were these things that I was holding on to? And then that also got into just wanting to understand the landscape around [me].”
Haeussler says geology was what first drew him to Alaska. He first visited for a geology field camp while in undergrad at Michigan State.
“That was my first visit to Alaska,” he relates, “And I thought it’d be just sort of a one-off, like, that was an interesting experience and [I’d] go and do other things. But for so many of us in Alaska, Alaska gets its claws in you, and then it doesn’t let go.”
While at the University of California Santa Cruz for graduate school, he proposed to study again in Southeast.
“In my mind, I had thought that Alaska is more the region between Anchorage and Fairbanks and not Southeast Alaska,” Haeussler says, “But looking at the issues that the scientific things that were worthwhile to study were ones down here in Southeast Alaska.”
While Southeast residents can’t usually sit and watch rocks move, there are consequences for communities living in geologically tumultuous zones. For example, the fast-moving Queen Charlotte – Fairweather Fault poses major potential seismic hazards to people living in Southeast.
“It’s maybe a little less important for a community like Wrangell that some distance away from it, but if you’re at Sitka or Elfin Cove, you’re really close to it,” Haeussler says, “And ground motions from something like that are something that need to be considered when building buildings, that kind of thing.”
But it’s not just the earthquakes that are a potential hazard. Haeussler points to a 1958 earthquake on the Fairweather fault. It’s maybe most famous for causing a rockfall in Lituya Bay which hit the water and created a megatsunami.
“That is still the world’s highest, world-record tsunami runup that went 1,740 feet, splashed up that hillside and out the bay,” Haeussler says.
Landslides, both on land and in the water, can trigger massive tsunamis with potentially devastating effects. Haeussler says the majority of fatalities from the 1964 magnitude 9.2 earthquake in the Prince William Sound were from tsunamis generated by underwater landslides, not from the earthquake itself.
Haeussler says work like his goes toward mitigating hazards through things like seismic hazard maps, which help dictate where and to what standard new construction happens.
“The hazard is going to be there no matter what,” Haeussler says, “So if you had an earthquake in the middle of nowhere, and it does all these horrible things, but nobody’s there, then it doesn’t matter.”
He says a prime example of that happened recently: “One example of that from Southeast Alaska is in 2015 there was another one of these big landslides from up in Taan Fjord in October, and then it went down, hit the water may made the fourth largest tsunami runup ever recorded, and then went out the bay and nobody even knew it happened. There was a hazard but there was zero risk because there was nobody there.”
Besides his boat being in Wrangell, Haeussler is in town to give a presentation, at the invitation of Sylvia Ettefagh, the organizer of Wrangell’s annual Bearfest celebration of late-summer bear season. It’s not bear season now, but Ettefagh says Bearfest is trying to expand its educational and cultural offerings beyond the confines of the five-day festival.
“Part of our goal for Bearfest is education,” Ettefagh explains. “That’s one of our missions, to bring information so that Wrangell can expand its knowledge base of the area in which it lives. And geology is part of that mix, if you know how your area was formed and what’s involved geologically in your area, you have a better understanding of where you live.”
Haeussler says he’s planning to talk about the basics of plate tectonics and the geological history of Alaska, as well as his recent research into earthquakes and tsunamis.
“I can talk a lot, or I could answer pretty much any – try to answer any question that somebody puts to me,” Haeussler says with a laugh.
He says in presenting his work to the public, his goal is to give people a better sense for how the geologic world around us got to where it is today, and to leave people with a sense of wonder about the epic history of the Earth right in their own communities.
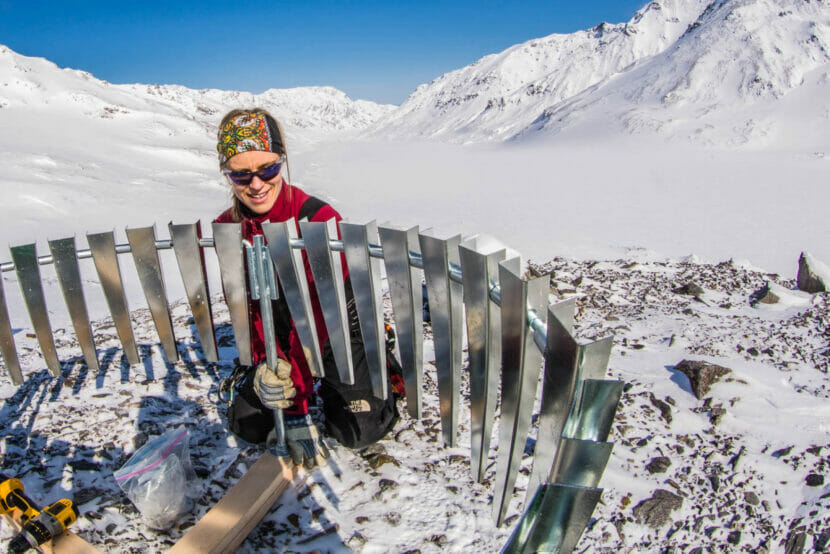
Anna Liljedahl on a research trip on Jarvis Glacier in the eastern Alaska range. Liljedahl is working to install a weather station on the glacier to model glacial melt. (Todd Paris/University of Alaska Fairbanks)
With permafrost thaw in the Arctic rapidly outpacing previous projections, researchers are racing to understand the impacts of an increasingly unstable future.
After growing up in Sweden, Anna Liljedahl moved to Alaska to study hydrology at the University of Alaska Fairbanks. She now lives in Homer, where she conducts research as an associate scientist at the Woodwell Climate Research Center, focusing on how climate change is impacting water in Arctic ecosystems.
Liljedahl is now leading a team to create more accurate, interactive maps of Alaska’s permafrost. Their project, called the Permafrost Discovery Gateway, is a novel effort to make Arctic research quicker to share and easier to access. That’s critical as the climate crisis accelerates thaw, impacting Alaskan communities and global carbon and methane emissions.
“Changes are happening so fast that we need to come up with automated ways of tracking this permafrost thaw through remote sensing imagery,” Liljedahl said, “and make automated tools that help us identify where change is happening.”
Permafrost is ground that remains frozen for at least two consecutive years, though some of it has been frozen for thousands of years. Scientists estimate that more than 80% of Alaska has permafrost. In some places, like the North Slope, it stretches continuously across the entire region, where it can be 2,000 feet thick. South of the Brooks Range, though, the permafrost layer is often much thinner, and broken up by patches of unfrozen ground.
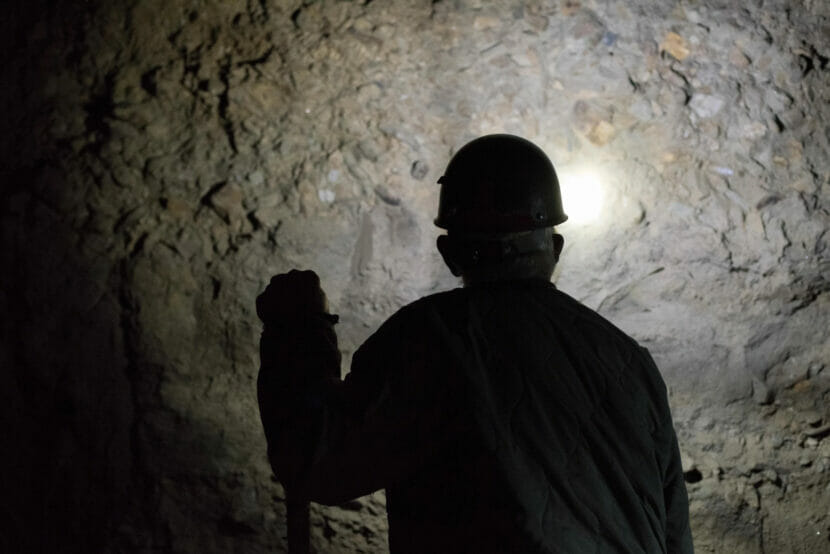
A gold miner inside of their privately owned permafrost tunnel outside Fairbanks, who often allows researchers to take soil and ice to study. (Sean McDermott/KBBI)
The actual ice content of permafrost also varies. Liljedahl said regions with high ice content, called ice-rich permafrost, are exciting from a scientific perspective, but also create the biggest challenges for houses, buildings and roads.
“So imagine, if you melt that ice, it’s going to become water,” she said. “Then suddenly the soil doesn’t have any support anymore.”
Though damage to infrastructure may not be as immediate as other natural disasters, rapid thaw is already having a huge impact on Alaskans. Some people, for instance, have had to level their home foundations multiple times a year.
“There’s insurance for flooding and hurricanes that people can buy and utilize, but when it comes to permafrost thaw, there’s nothing,” Liljedahl said. “People are just left on their own.”
Getting a better sense of how much ice is in Alaska’s permafrost is also important for modeling potential greenhouse gas emissions as it disappears.
“You need to know how much carbon is in the permafrost to begin with, and that estimate depends on how much ice you have,” she said. Permafrost with less ice in it has more organic material, like frozen roots, which release more greenhouse gasses like methane when it thaws.
With temperatures rising across the far north, the climate crisis is rapidly changing the ground. Liljedahl said it can take a decade for research in the Arctic to get peer-reviewed and published, and with changes now outpacing many projections, that’s just not fast enough.
“Ten years is a long time frame in Arctic permafrost thaw,” she said.
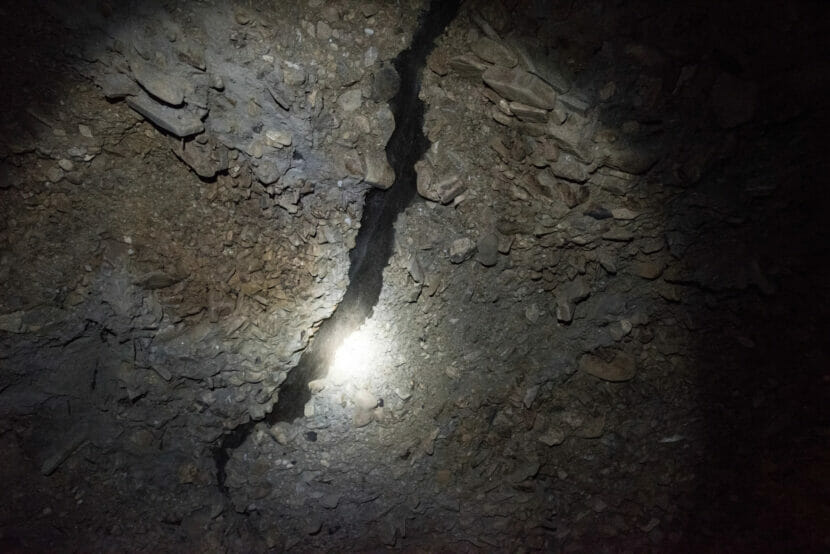
An ice wedge in the wall of a privately owned permafrost tunnel outside of Fairbanks. (Sean McDermott/KBBI)
The Permafrost Discovery Gateway provides a new level of detail and scale to mapping the Arctic, and could help fill these gaps with more automated tools, helping scientists better track how these ecosystems are shifting.
“We had to create our own software, our own visualization tool, where you can view this really, really big map at the pan-Arctic scale, and at the same time, zoom in and look at what’s happening in your backyard,” Liljedahl said.
One of the features this high-resolution imagery can help researchers identify are called ice-wedge polygons. Over years of freeze and thaw cycles, water flows into cracks in the ground and gradually builds into walls of ice below the surface. These ice wedges push soil into distinctive shapes — visible to satellites — and stand out as they thaw, causing the ground above to slump or new ponds to form.
Being able to see these kinds of changes is shedding new light on Arctic trends. Elizabeth Webb is a postdoctoral researcher at the University of Florida who has shared research on the Permafrost Discovery Gateway database. She has been studying the connection between vanishing surface water and permafrost thaw.
Previous models projected thawing would initially increase water in lakes, and then decrease later this century with more sustained warming. But that’s not how things seem to be playing out.
“What my research was showing is that it’s just the very beginning of the 21st century,” Webb said, “and we have already reached the latter part of that continuum.”
Instead, in some regions, surface water is disappearing more quickly than anticipated, according to research Webb and Liljedahl published earlier this year. Warmer temperatures lead to increased autumn rainfall in the Arctic, so having less surface water is a little counterintuitive, Webb said.
“You would think more rain would mean more water. But actually, more rain means more permafrost thaw — which means more drainage.”
This can be a big issue for Arctic communities. Not only can permafrost thaw damage homes and infrastructure like pipes, it can also impact the availability of reliable drinking water as lakes shrink or drain completely.
“People rely on lakes for household use and for drinking water. It’s not like all the lakes are going to drain and then suddenly, there’s not going to be any water left for them,” Webb said. “But it does mean that these communities are now more vulnerable.”
Researchers across the state are working hard to better understand these intricacies — and the unique Alaskan landscapes permafrost has created. On a recent virtual tour of the U.S. Army Corps of Engineers’ permafrost tunnel in Fairbanks’ Goldstream Valley, senior scientist Tom Douglas welcomed more than 500 viewers across the country on a journey back through time.
With geologic formations stretching millennia, Douglas said that there is no other tunnel quite like this one.
“You can wander through, and on the walls you can map different features. You can measure them, you can do statistics on them, [and] we can collect samples representing about 40,000 years of permafrost formation,” he said.
Getting field data from different areas around the state is still a huge challenge, making samples from the permafrost tunnel incredibly valuable. The tunnel offers a glimpse of geologic shifts in permafrost, and an up-close look at changes that satellites can’t see from above.
Douglas said permafrost researchers need to get better at talking to the public about their work, sharing data and making information more accessible. That includes everything from looking at historical mining pictures, to getting people across Alaska to share their lived experiences and observations.
“We really need any type of information possible and ways to basically accumulate, synthesize and display that information,” Douglas said.
Permafrost may be a northern phenomenon, but the consequences of carbon emissions released around the world have a huge impact on how quickly these changes are happening in Alaska. Permafrost holds twice the amount of carbon than is currently in the atmosphere, Douglas said. Accelerating thawing also has the potential to magnify the impacts of climate change globally — releasing more carbon and methane and speeding temperature rises.
Liljedahl said using tools like satellite imagery, mapping, and up-to-date visuals can help create a better picture of this rapidly changing area of the world.
“We’re not just talking about 50 years from now. We’re talking about what happened yesterday, and what’s happening right now.”
You can take a digital stroll back through thousands of years of geology on a virtual tour of the permafrost tunnel outside of Fairbanks, and explore the growing database of permafrost research on the “Permafrost Discovery Gateway.”
Close
Update notification options
Subscribe to notifications
Subscribe
Get notifications about news related to the topics you care about. You can unsubscribe anytime.