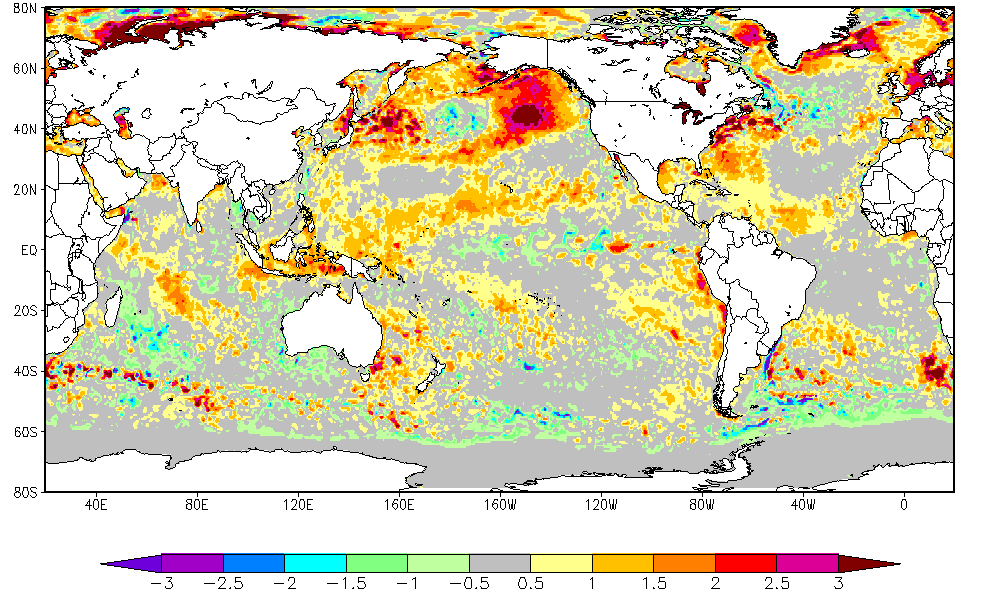
A map of sea surface temperatures from Sept. 19th shows the blob below Alaska. (Graphic courtesy of NOAA)
The Blob is back. The term was coined a few years ago to describe a warm patch of water in the Gulf of Alaska and northern Pacific Ocean. It can turn the weather warm and dry in the state.
Brian Brettschneider is a climatologist in Anchorage who closely tracks Alaska climate data and trends. Alaska’s Energy Desk is checking in with him regularly for the segment- Ask a Climatologist.
Brettschneider says earlier this year, it looked like the Blob was gone, but that wasn’t quite right.
Interview Transcript:
Brian: It’s always been there, it’s just been hovering below the surface, so if you looked at sea surface temperatures, it kind of looked like it was getting back to normal, but all that warmth was just kind of pushed down a little bit and now it’s making its way back to the surface. And it really looks like the blob again.
Annie: And when you look at a map of this, it’s really striking, can you describe it?
Brian: When you look at these maps of sea surface temperatures- the ones that have been released the last few weeks- they really show this very pronounced warm water anomaly sitting just south of mainland Alaska in the Gulf of Alaska. Of course the colors they use in the maps in general for above normal conditions are red, so you have this red circle sitting below Alaska and it really does look like a blob.
Annie: What effect does this have on Alaska?
Brian: When there’s warm waters that surround Alaska it really promotes warm surface temperatures in the state. It also affects the upper level patterns. The last time the blob was this pronounced we had a strong upper level high pressure that set up and that really kept us dry. And then to the downstream side of that in Canada and the northern part of the lower 48, that actually drove their winds, made [them] come from the North, so it made it colder and snowier over there. But over here, in our part of the world, it promoted above normal temperatures and below normal precipitation.
Annie: And what is the connection between the blob and global warming?
Brian: Global warming, I like to say, adds a baseline. It’s like a background noise that gets slightly louder every year. But the blob is something that sits on top of that. So for example, at some point in the past, a blob pattern may have only been two or three degrees above normal, whereas now its four or five, maybe six degrees above normal. So it’s just something that adds on to the background conditions.
“It had indications of hemorrhage where it had been struck and possibly carried by a ship,” she said. “So there are areas of trauma that look convincing that it had had a major blunt impact.”
It was likely a large vessel, such as a tanker, cruise ship or ferry, she said, but she’s not positive.
“We can’t quite say it definitively at this point,” she said. “First of all, we’ve only had a limited amount of time to access the animal because of the tides. Also, because there’d been a lot of changes because the animal had rotted for a while.”
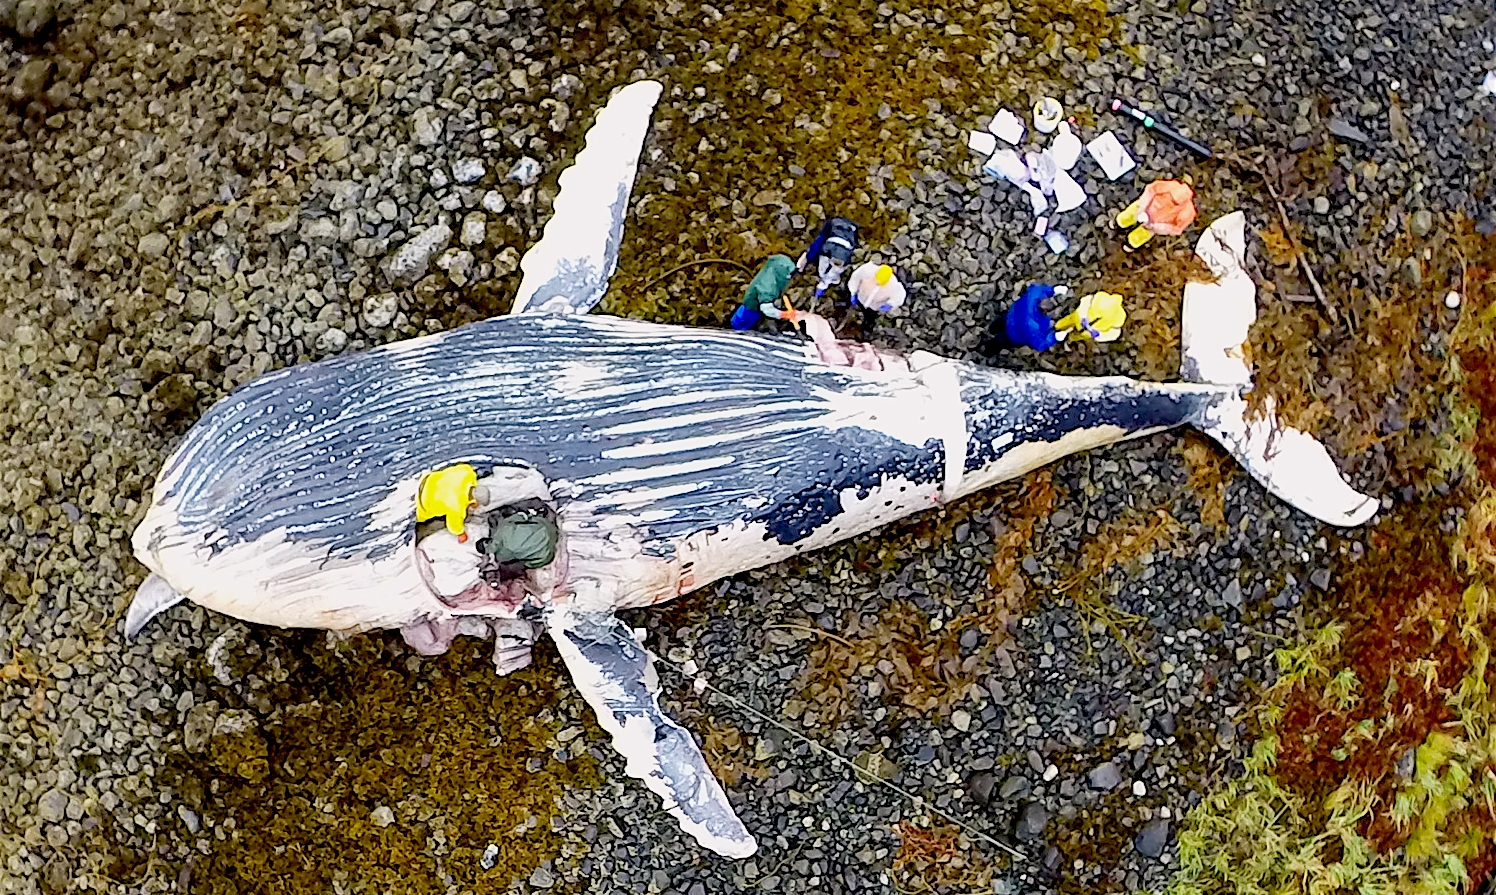
Researchers collect samples from a beached humpback whale carcass Saturday on a Sitka Sound beach. (Drone photo by Joe Serio)
The team cut into the whale, removing blubber and other tissue for further study.
Burek said they climbed into the carcass for the difficult task of finding and removing its ear plugs.
“These plugs are formed by yearly laying down of ear wax,” she said. “And since a whale doesn’t have a big opening out from the ear, it just tends to accumulate. If you can get that, there are ways to count those rings and be able to be more definitive about how old the animal was.”
The whale’s age is not yet determined. It takes a month to analyze the plugs, Burek said.
Other samples will be used to determine whether the whale had been exposed to toxic algae blooms.
Those have become more common as climate change has warmed the Pacific Ocean.
Scientists are also interested in discovering what the whale had been eating, Burek said. In a southern Baranof Island whale death earlier this summer, the animal turned out to be malnourished.
“We didn’t actually figure out a cause of death at all on that one,” she said. “But its body condition did not look optimal, so that’s another reason why we’re doing those studies on nutrition.”
The most recent whale carcass was left tied up on the beach, a present for the bears, Burek said.
She also hopes follow-up examination will reveal more information about its injuries.
Cattle had to be driven through the waters of a flooded road, and then trucked to higher ground on Aug. 16, in Sorrento, La. About a third of the flooding in the state last month occurred outside the local flood plain. (Photo by Joe Raedle/Getty Images)
The floods that hit Louisiana last month were caused by rainfall that was unlike anything seen there in centuries. Most of the southern part of the state was drenched with up to two or three inches in an hour. A total of 31 inches fell just northeast of Baton Rouge in about three days; 20 parishes were declared federal disaster areas.
Climate scientists and flood managers suspect there could more like that to come — in Louisiana and in other parts of the country.
There have always been extraordinary rainstorms — storms stronger than anyone can remember. But Nicholas Pinter, a geologist at the University of California, Davis, who researches floods, says we shouldn’t write these off as once-in-a-lifetime freak events.
“[In] our experience,” Pinter says, “these kind of — call them ‘acts of God explanations’ — are served up just a little too easily.” Sure, he says, amazing rainstorms do happen. But lately, big floods seem to be following storms more often.
“Hundred-year floods — floods of a magnitude that usually occur only once a century — [and] other large [weather] events are occurring bigger and more frequently than the published probabilities predict,” Pinter says.
And some of those floods look different.
For example, satellite photos show that about a third of the flooding in Louisiana last month was outside the local flood plain. The flood plain is the area that historically gets inundated by a once-a-century flood.
Pinter says floods that occur outside the historical flood plain appear to be happening more often — in Louisiana and elsewhere.
“Maybe we’re seeing a different character of flood event beginning to appear,” he says. “More like a climate-driven flash flood event that’s affecting these big river systems, which might be a new and different phenomenon that we need to throw into the statistics. Maybe.”
A heavy rain, for example, that flashes down onto urban areas and just overwhelms sewers and drains might be this sort of event, he says.
At this point, the evidence that the increasing floods is climate-related is still tentative, because you need a lot of storm data over many years to identify a trend. But Paul Osman, flood plain manager for the state of Illinois, is seeing changes too. Osman studies floods for the state and is charged with figuring out how to prepare for them. He calls these sudden floods that lie outside of flood zones “drainage events.”
“We found that 90 percent of our damages in Illinois are not traditional overland flow damages (like a river overflowing its banks),” he says, “but rather heavy rainfall events that cause basements to back-fill with water.”
Osman says a 2015 study by Illinois flood authorities found that between 2007 and 2014, almost all the flood damage in urban areas occurred outside the traditional flood plain.
Osman says he suspects that’s partly because the region is increasingly covered by concrete — shopping malls, parking lots, and other impervious surfaces that lead to flash-flood runoff. But he says he and other flood plain managers are noticing a shift in rainfall patterns, as well.
“There’s no doubt,” Osman says. “All the scientific evidence points at those rainfalls, [which] are changing. We’re having a lot more of these intense, short-duration storms that happen in relatively small geographic areas” — such as the regions recently affected in Louisiana.
That’s consistent with what climate scientists have been predicting. A warmer atmosphere holds more water vapor and can create bigger, more intense storms. And the federal government’s latest National Climate Assessment notes that average precipitation is up overall in the U.S., and points to particularly intense rainfall events in the Midwest and East.
Osman says many drainage systems can’t handle these intense storms. “Most of those storm sewer designs were built on historic records and historic rainfall events that are no longer the case,” he says.
If historic rainfall data no longer hold true, that’s a problem for the Federal Emergency Management Agency. FEMA draws up maps that show where flood plains are. People with federally backed mortgages in the highest risk areas have to get flood insurance. People outside those areas don’t.
Kathy Schaefer is an engineer who spent 10 years drawing those maps at FEMA, and says those in use now don’t take into account any rainfall changes that might have started to take place because of climate change.
“You had to ignore climate change [in drawing the maps],” she says. “All of the mapping had to be based on the existing conditions [at the time they were drawn, or many years earlier].” Those conditions were rainfall and flooding statistics from the past, she explains. Sometimes decades in the past.
Schaefer says local flood managers have begun to suspect that “existing conditions” are changing. But, until recently, anytime they came to Washington, D.C., looking for help to deal with those changes, they had to mince their words.
“They [couldn’t] even use the words ‘climate change,’ ” she says. “They call it a ‘slow moving disaster,’ which is sort of a code word for climate change.”
Over the past couple of years, FEMA has begun to consider climate change in its flood analyses, Schaefer says. An executive order from the White House now requires it, and the agency is also proposing new operating procedures that require research into the effects of climate change on flooding.
But there’s a time-lag problem: FEMA only updates its insurance flood maps every five years. Climate scientists fear that the weather may be changing faster than that.
Copyright 2016 NPR. To see more, visit http://www.npr.org/.
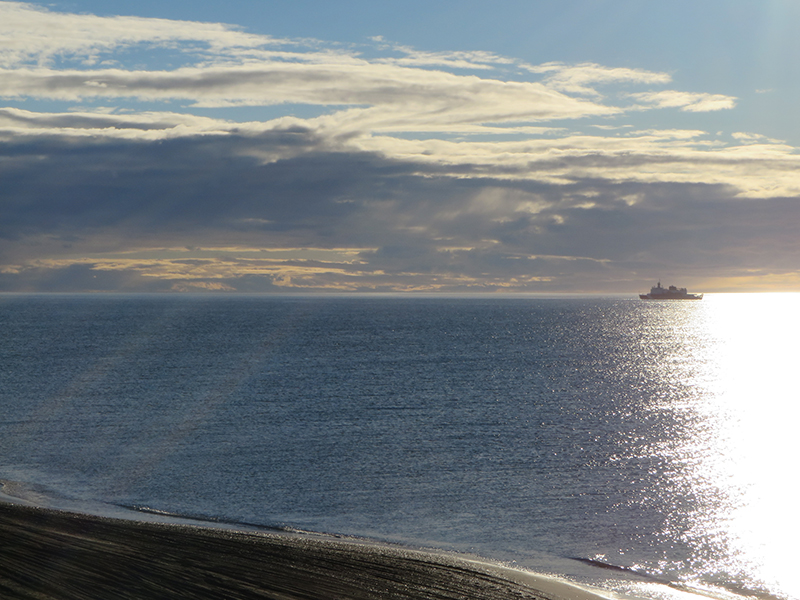
The U.S. Coast Guard icebreaker, Healy, sits just offshore of Barrow, shortly before setting sail on Arctic Shield 2013. (Photo courtesy of NOAA Office of Response and Restoration)
Over 450 representatives from 90 countries are expected to attend a two-day conference in Washington D.C. on the health and sustainability of the world’s oceans.
U.S. Secretary of State John Kerry is hosting the Our Ocean 2016 conference on Thursday and Friday.
President Barack Obama and Kathryn Sullivan, Under Secretary of Commerce for Oceans and Atmosphere, are expected to attend along with more than 40 foreign ministers and heads of state, plus explorers and scientists, members of the private sector and environmental activists from around the globe.
“Clearly, the challenges facing our ocean respect no boundaries,” Kerry said in a video posted on a U.S. State Department website.
Kerry said that’s why there’s a need to come up with global solutions.
He said government leaders, civil society, and business leaders have already pledged $4 billion in maritime sustainability initiatives, and promised to set aside an area nearly the twice the size of India in marine protected areas.
“Today, our ocean is suffering from massive quantities of plastic waste and pollution that run off from streets and farmlands around the world,” Kerry said. “The richness and diversity of our marine resources are being decimated by reckless and illicit fishing practices. Climate change and the excess carbon dioxide that helps cause it is making our ocean warmer and more acidic, hurting our fisheries. Climate change is also increasing the intensity of coastal storms, damaging the environment and putting at risk the billions of people who live in coastal communities, many of whom are economically dependent on the ocean and its resources.”
This year’s conference is a follow up to Our Ocean 2014 and will focus on protecting marine areas, mitigating the impacts of climate change, promoting sustainable fisheries and combating illegal fishing, and reducing marine pollution.
During a briefing with stakeholders Tuesday, U.S. State Department officials said this week’s events also will a feature a youth conference at Georgetown University that will be attended by 150 youth leaders from 50 countries.
Alaska’s glaciers are having an outsized impact on global sea level rise. Dr. Michael Loso, physical scientist at Wrangell-St. Elias National Park, explains what’s happening to ice in the Last Frontier.
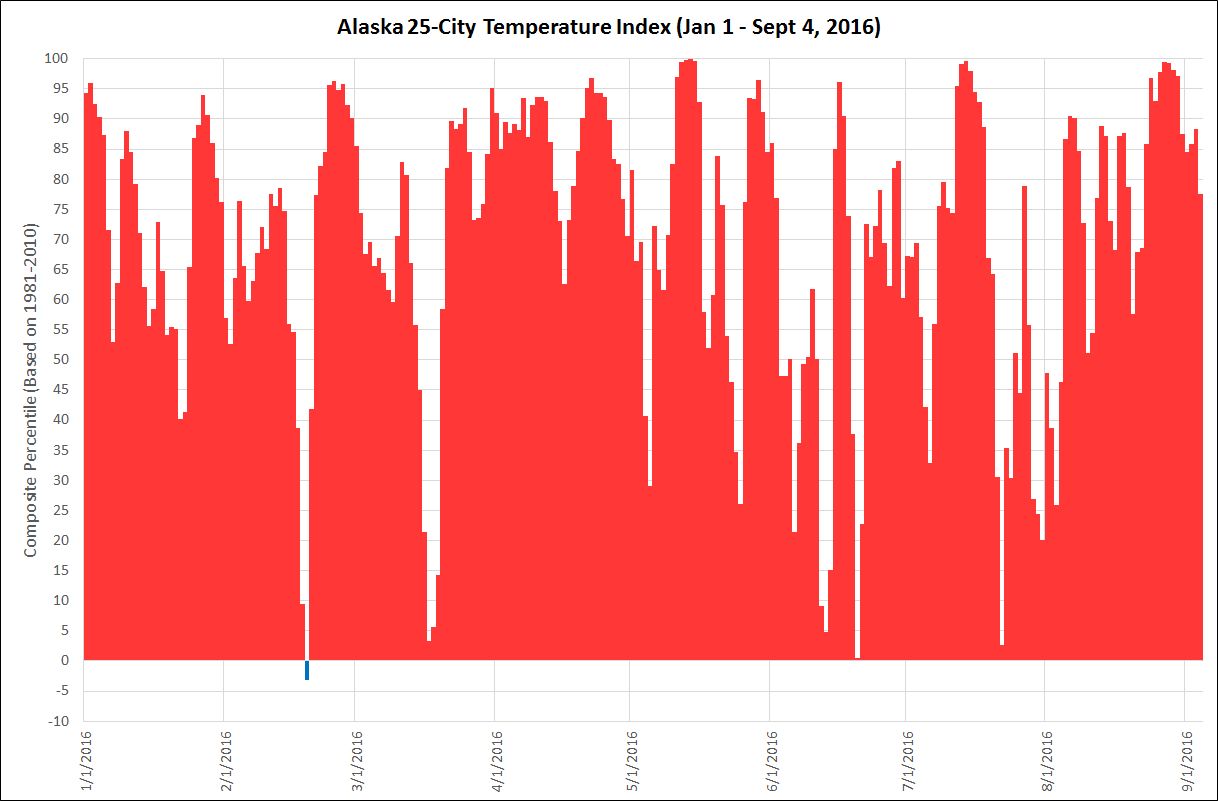
Almost every day of 2016 has been above normal in Alaska. (Graphic courtesy of Brian Brettschneider)
Tuesday marked the 200th day in a row of above normal temperatures for Alaska. Even in a string of unusually warm years for the state, that’s a remarkable run.
Brian Brettschneider is a climatologist in Anchorage who closely tracks Alaska climate data and trends. Alaska’s Energy Desk is checking in with him regularly as part of a new segment- Ask a Climatologist.
The daily average statewide temperature is based on an index of 25 cities across Alaska.
Interview transcript Brian: Individual cities may have a few below normal days sprinkled in here and there, but on the aggregate it’s been above normal every single day of 2016 except for one and that was Feb. 9.
Annie: And how unusual is that?
Brian: The last two years, 2014 and 2015, were the two warmest years on record, dating back to 1925, when they started keeping stats. Each of those two years had at least 60 days that were in the lowest third of temperature categories. And this year we’ve had no days in the lowest third of temperature categories and only one day that was even slightly below the normal. So it’s almost a near certainty that 2016 will be the warmest on record for Alaska.
Annie: And we keep talking about these warm ocean temperature around Alaska. How much is that a factor?
Brian: Well it’s definitely a factor. You’ve got this unlimited reservoir of warm ocean water which facilitates warm temperatures in the air right above that water, so it really acts as a floor for how low temperatures can go.
Annie: And what are you seeing in the August data for those ocean temperatures?
Brian: For the ocean temperatures surrounding Alaska, and I’m talking mainly south- so Gulf of Alaska, Bering Sea- the summer of 2016 was the second warmest on record. Last year was the warmest on record. And 2014 was the third warmest on record. So it really goes to show how anomalously warm the atmosphere and the environment is around Alaska that really is preventing us from having even normal temperatures.
Close
Update notification options
Subscribe to notifications
Subscribe
Get notifications about news related to the topics you care about. You can unsubscribe anytime.

9(MDEwMjQ0ODM1MDEzNDk4MTEzNjU3NTRhYg004))